Do you want to know how it works?

Hey folks, Ben here.
I've traded triangles since I started in the markets, close to a decade ago. A triangle is the market telling you something has to give: price squeezes into a point, and then it breaks.
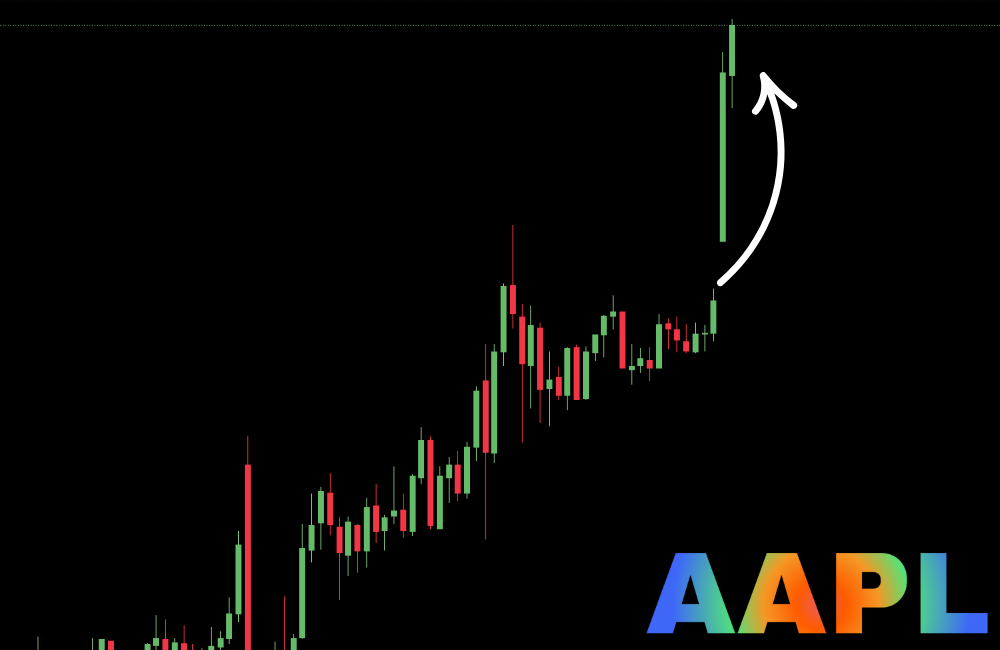
My problem was never spotting them. It was time. I'd open a chart, see a perfect triangle, clean lines and an obvious breakout coming, and by the time I checked back, the move had already happened. Like this one on AAPL:
Too many tickers, too many timeframes, not enough hours. So I built an algo that reads every chart for me, at every close. I call it the TriHex Algo. One algo, six triangles.
Most indicator sellers keep how it works a secret. I'm going to show you every rule, step by step, and then show you the rules working on a real call on our own charts. No black box.
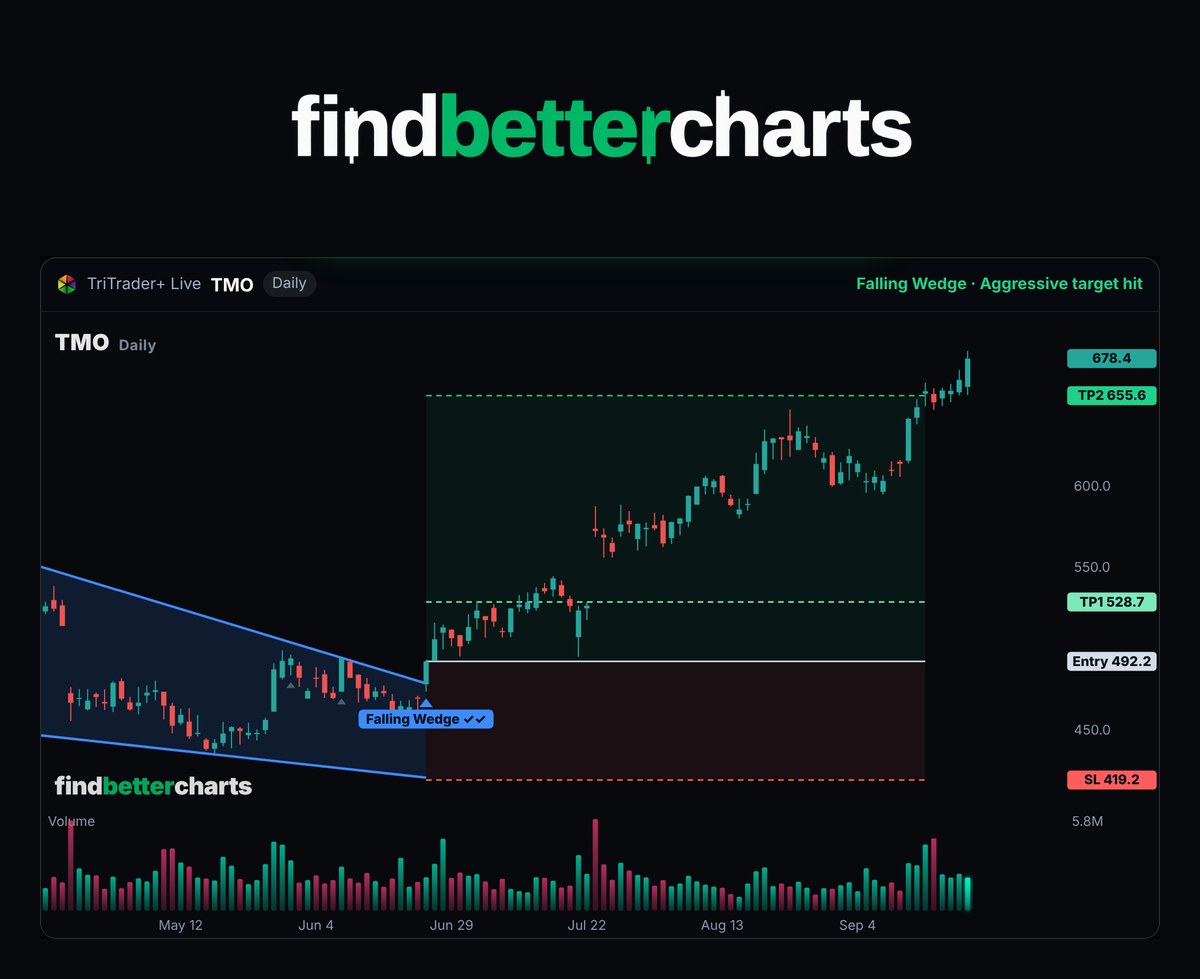
The TriHex Algo, step by step
Every TriTrader+ call goes through the same five steps. Here they all are on one picture:
It finds the anchors.
A swing high is a candle whose high is above the 5 candles on each side of it. A swing low is the same, underneath. Those are the only points TriTrader+ draws through. No guessing which wick counts.
It draws the lines, and makes them earn it.
A line runs through two swing highs, another through two swing lows. A line only stands if price respects it: no candle closes more than a quarter of a normal candle's range past it, and at most two wicks poke through.
Every swing that comes back to the line counts as a touch. A triangle needs at least 5 touches between its two lines, and each line has to be touched at least twice. Fewer than that, and it is just three random wicks.
It names the shape.
The two lines have to squeeze together: the gap at least 25% narrower at the end than at the start, and meeting no further ahead than the pattern is long. Then the slopes say which of the six it is.
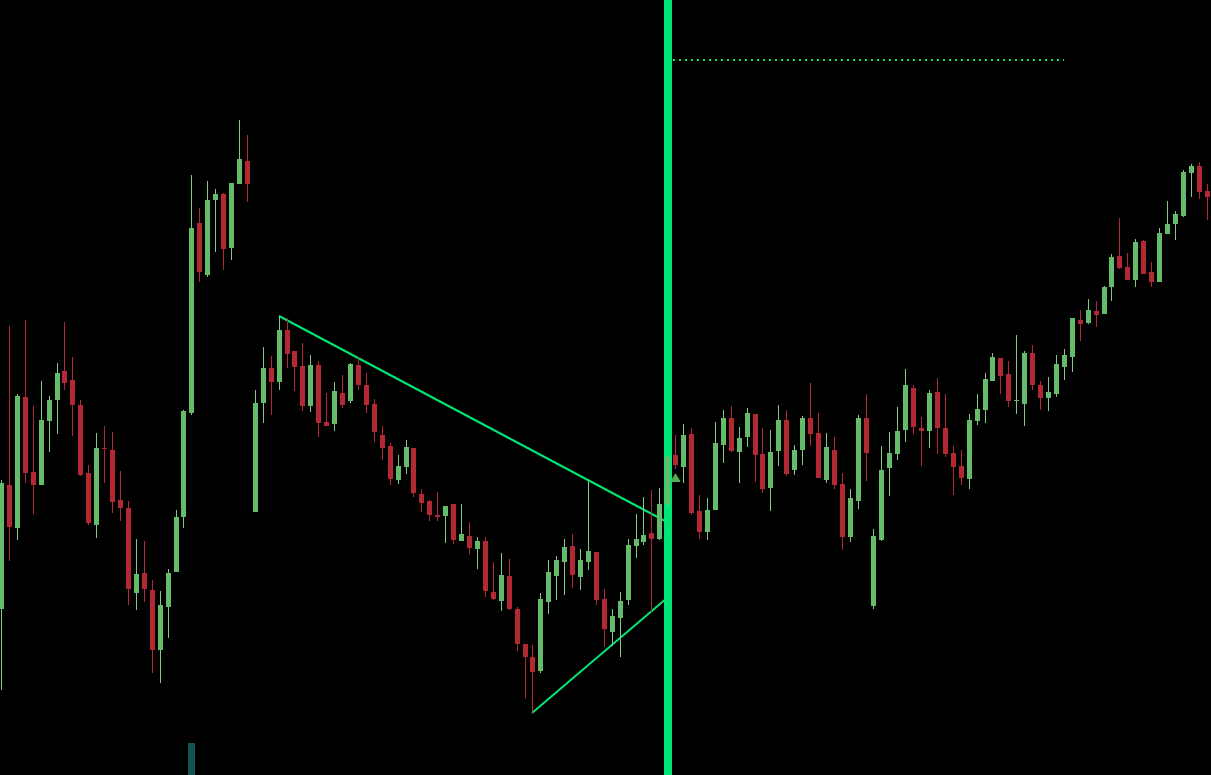
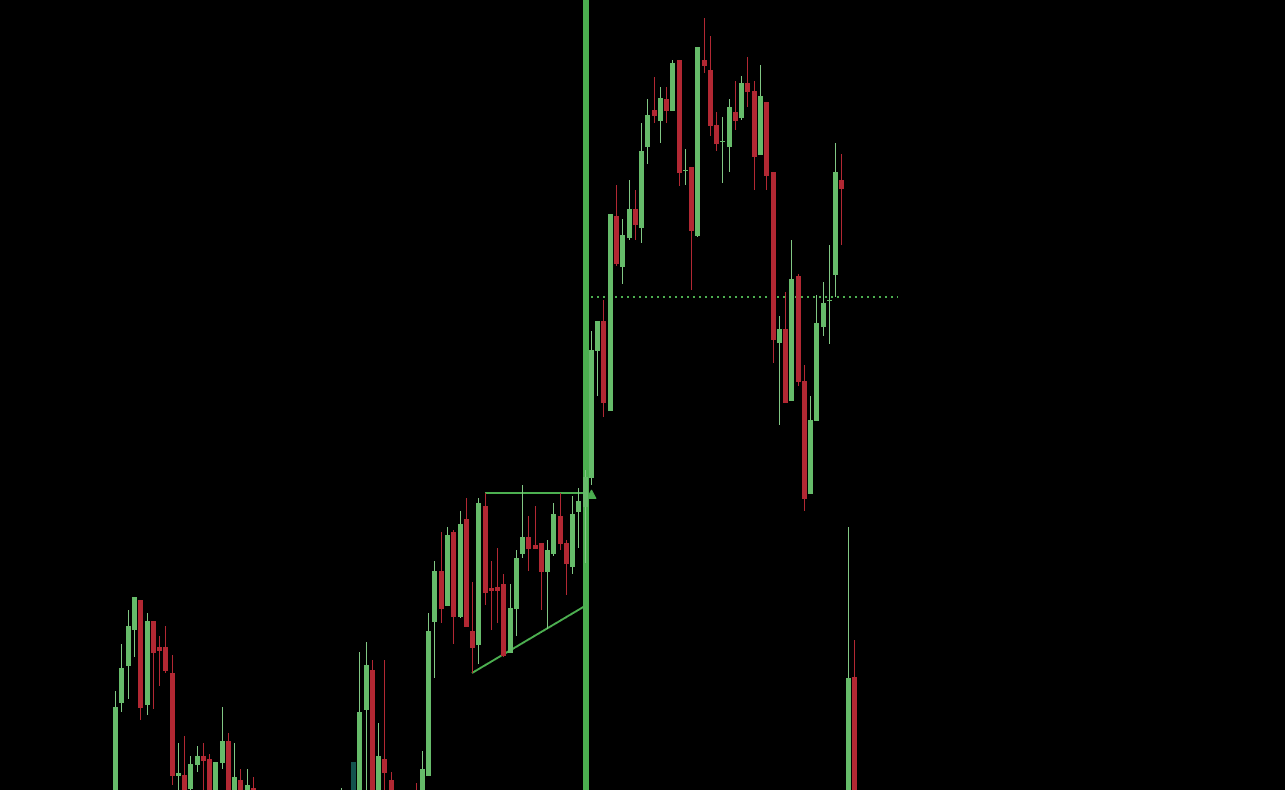
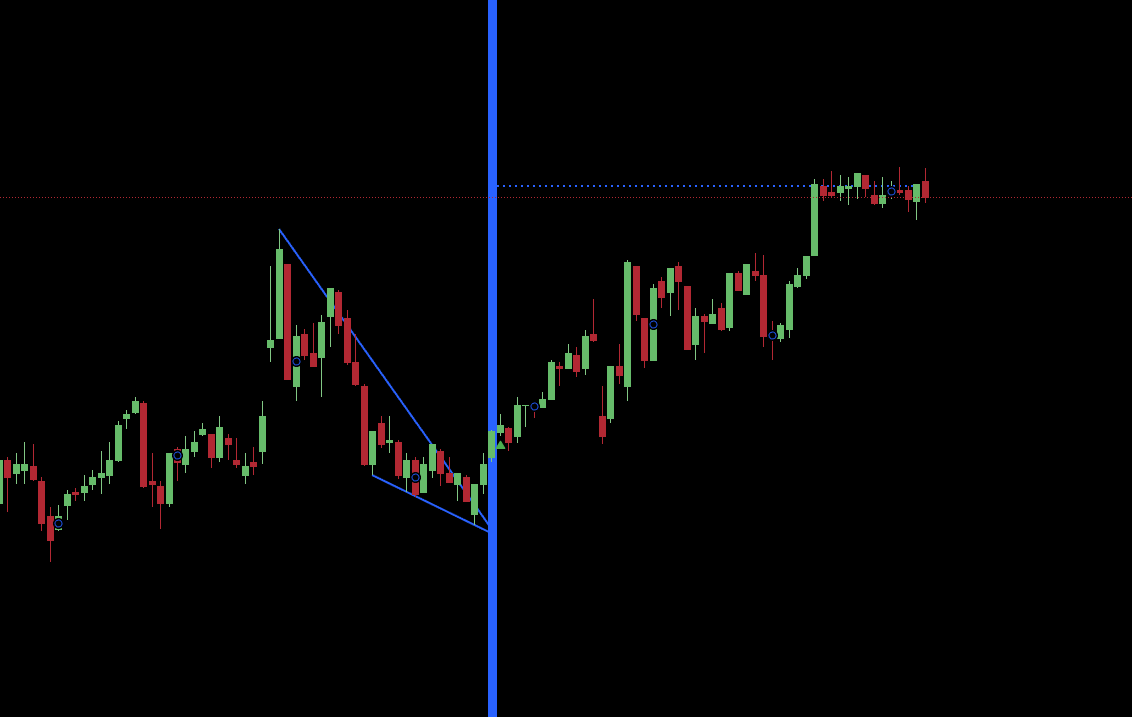
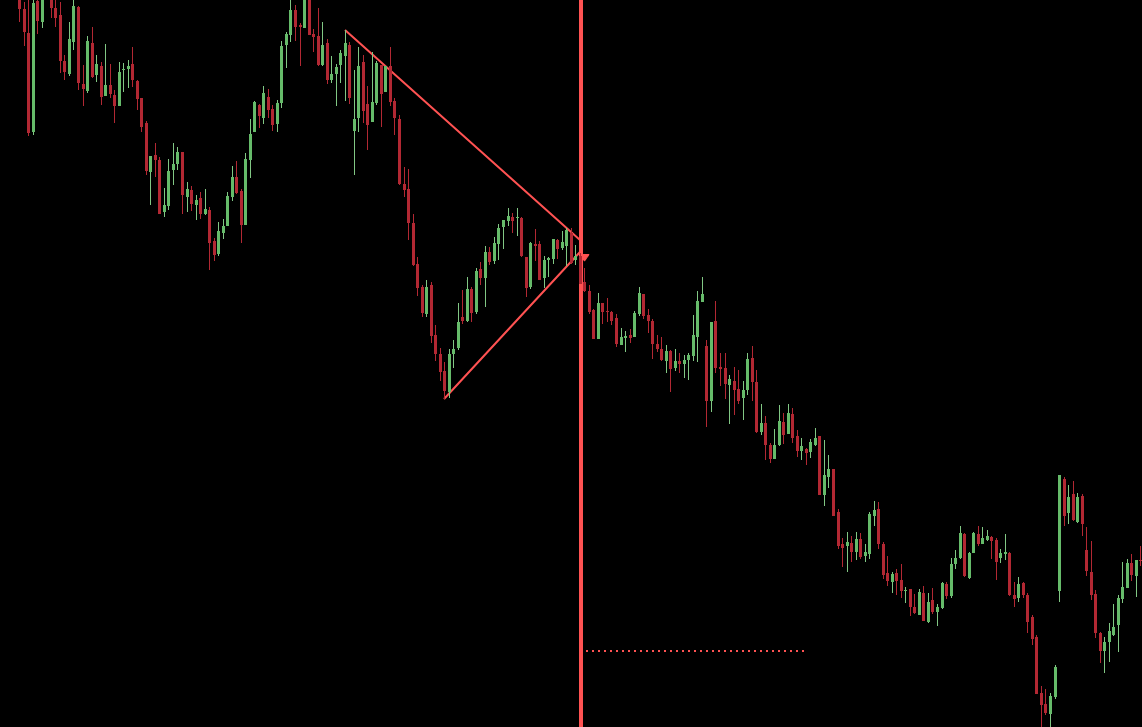
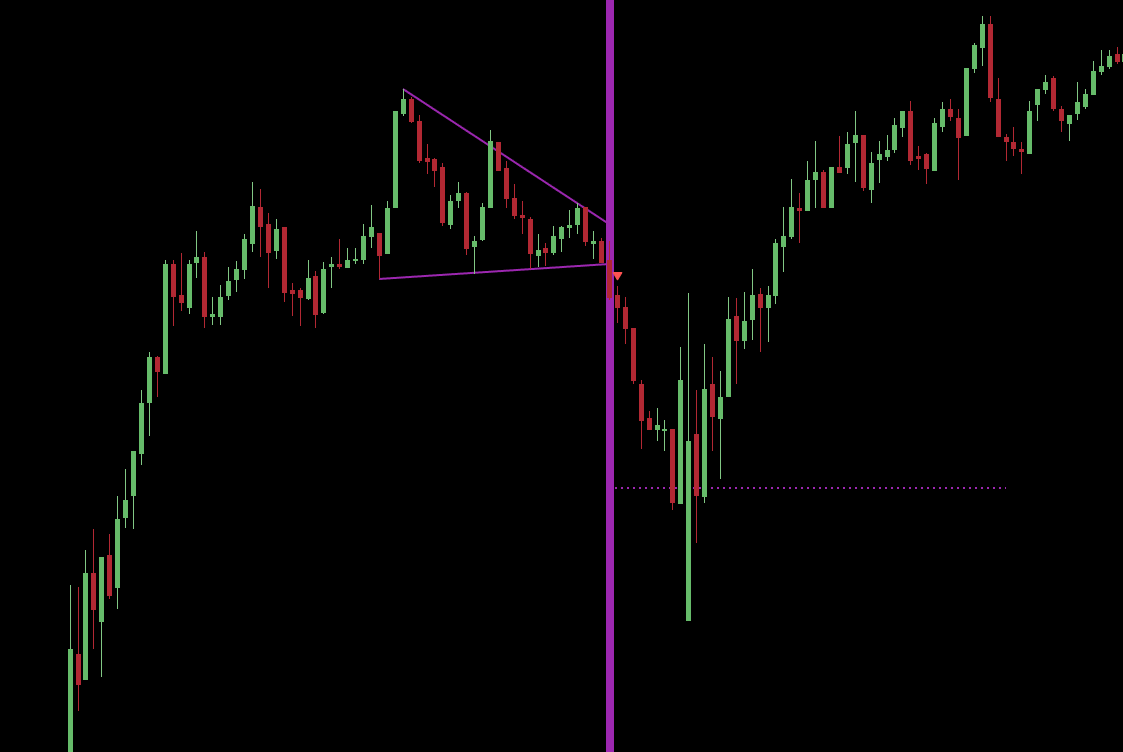
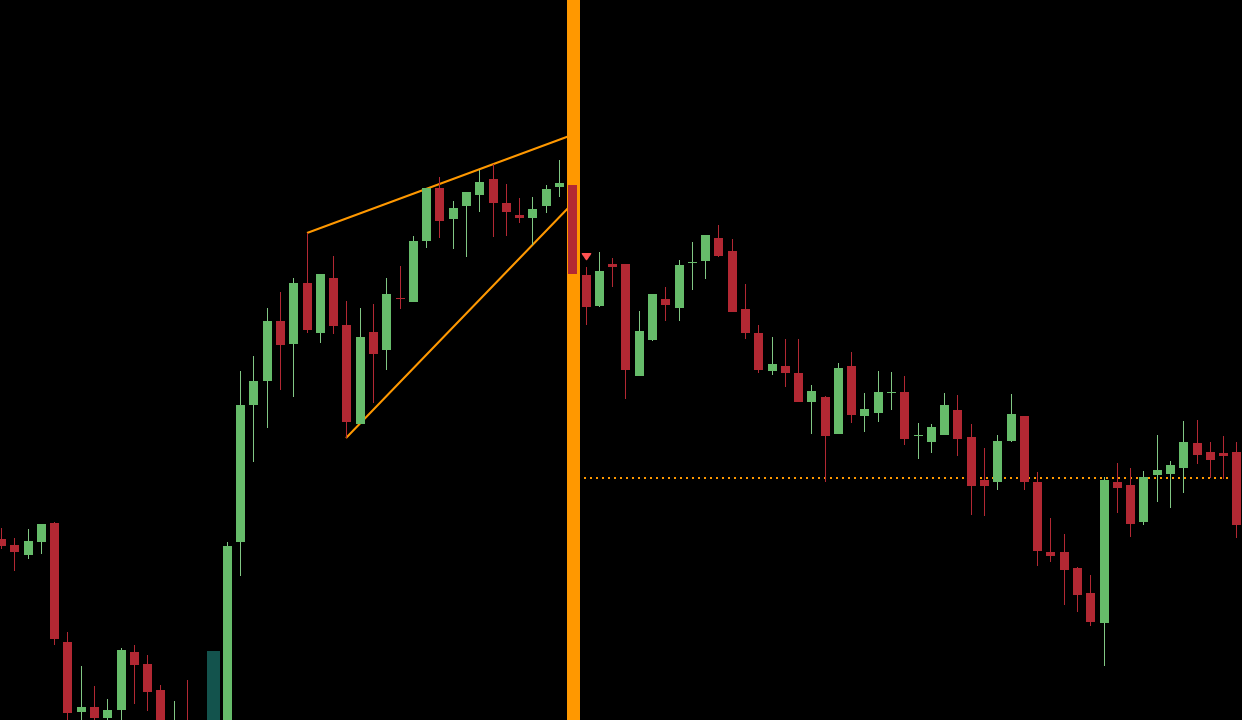
It waits for the close, then runs the checklist.
A wick through the line is not a breakout. A candle has to close through it. Then, before it calls a buy, it checks the box for that chart:
- A buy shape: Symmetrical, Ascending, Falling Wedge, or a Descending Triangle broken to the upside
- A decisive close: at least half a normal candle's range past the line
- Big enough to matter: the triangle at least 10% of the price tall
- The market behind it: SPY above its 50-day average
- An Ascending or a Symmetrical Triangle
- Big enough to matter: at least 10% of the price tall
Miss one box and there is no call. The triangle is still drawn, so you see what the chart is doing, but TriTrader+ stays quiet.
It hands you the plan.
Entry: the close that broke the line. Stop: under the triangle's lower line, at least one normal candle's range away, and only a close below it stops you out.
Conservative target: half your risk above the entry. Take half off there and move your stop up to the entry, so the rest of the trade can't turn into a loss.
Aggressive target: the triangle's own height, measured up from the entry. If neither target comes inside 60 candles, the call is closed.
Why these rules and not others? We didn't take them from a book. We replayed the triangle finder over two years of more than 200 stocks and ETFs and kept only the versions that made money in both years. The 1-hour chart had no edge, so TriTrader+ doesn't call it. The sell side lost on every timeframe we tried, so the sells are drawn on your chart, never called. These are the best setups we found, and nothing else gets a call just to look busy.
The six triangles, on real charts
Here's what each of the six looks like, beautifully painted on our own charts, Find Better Charts: the triangle shaded, its two lines, and the candle that closed out of it. Then where price went after. These are the pictures you'll see on your own charts, on any timeframe you like.
Past moves, picked to show each shape clearly, not a promise about the next one. Plenty of triangles break and go nowhere.
Right now on TriTrader+ Live
There are triangles forming as you read this, and some just broke. Here's the board right now:
These are for members only. But you can get all of them right now.

You're handpicked: TriTrader+ on Find Better Charts
Here's something we've never put on this page before.
We built our own charting platform. It's called Find Better Charts, and right now it's in a private beta. Not everyone gets in. We hand-pick who does, because we want traders in there who will actually use it.
Grab TriTrader+ on this page and you're handpicked for the beta. It's switched on the moment your order goes through, in the same members area, at no extra cost. Its value: $997. Yours free with TriTrader+ today.
Trade it how you want: any timeframe you like
Open any chart, on any of those timeframes, and TriTrader+ draws its triangles right on it: the 5-minute for a quick trade, the daily for a swing, the weekly for the big picture.
The calls themselves come from the daily and the 4-hour, the two timeframes that tested best, so you always know which ones we trade. Everything else is yours to read your way.
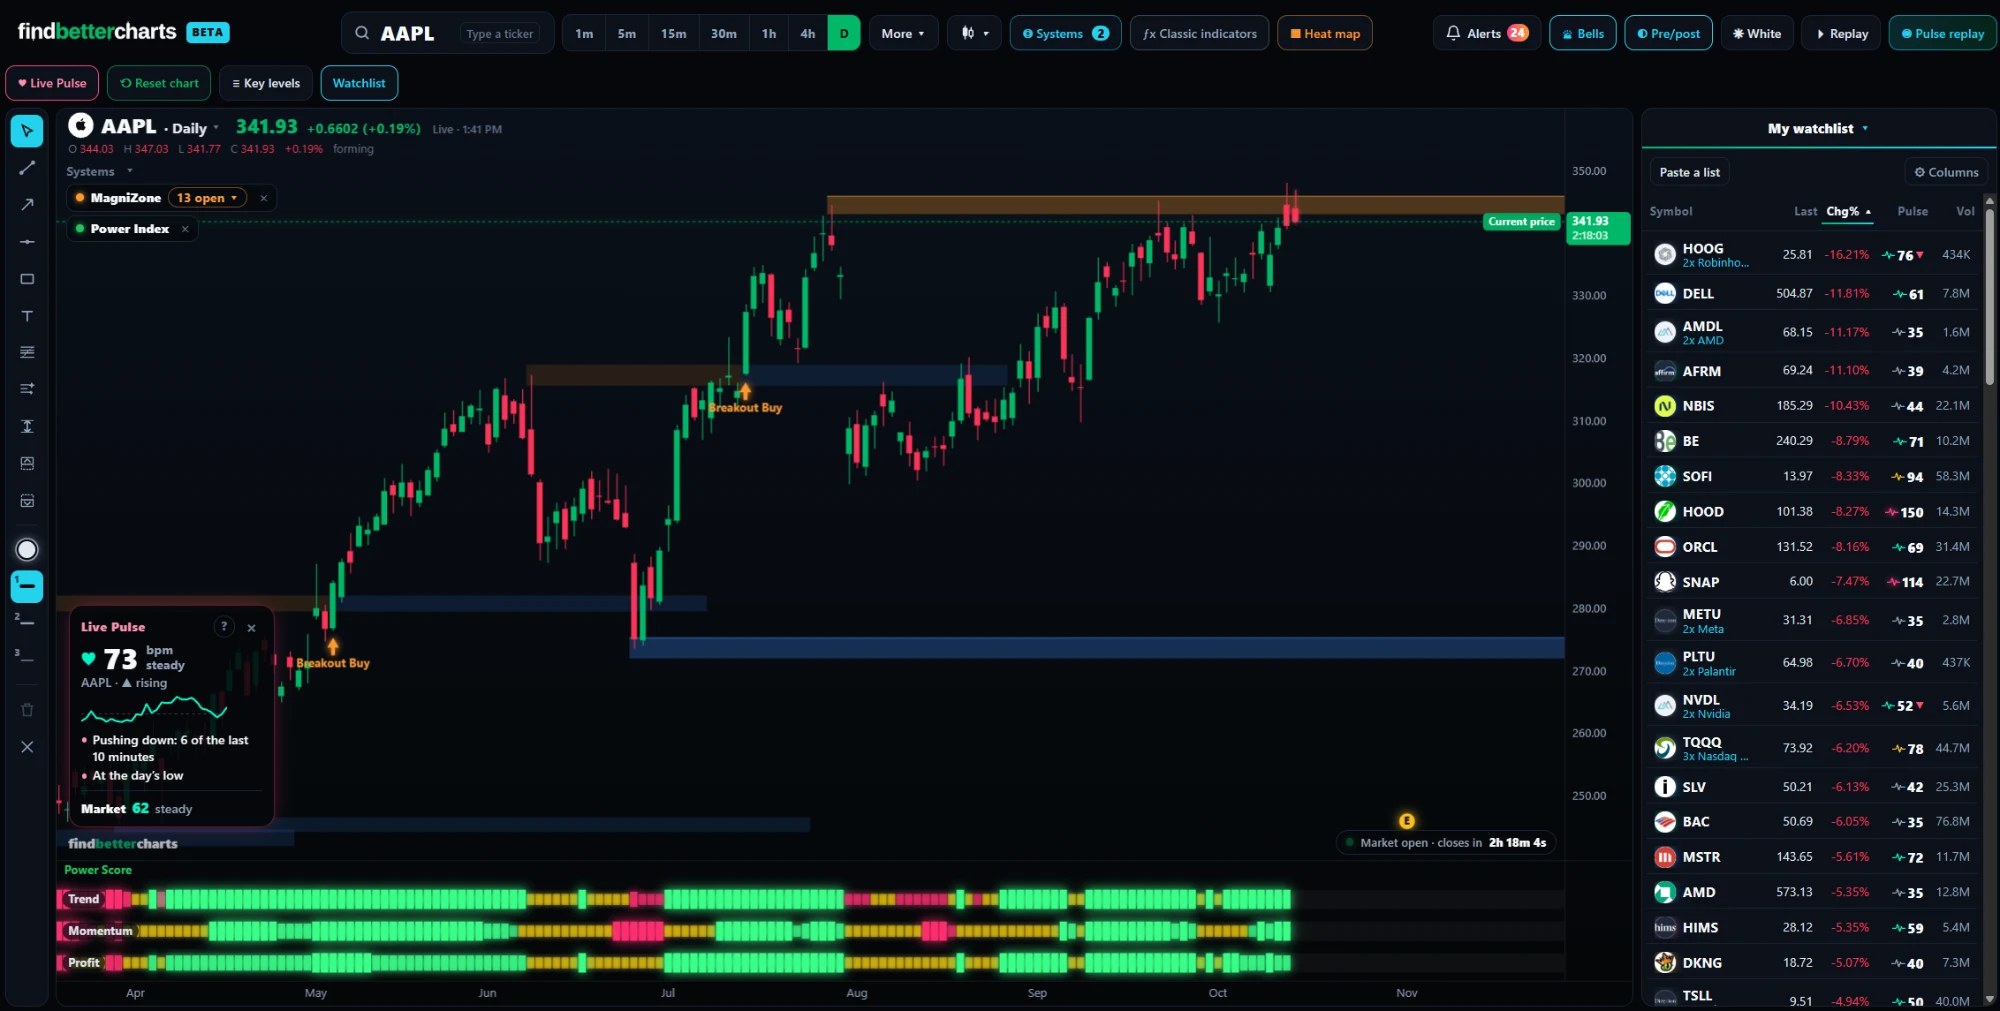
- TriTrader+ drawn on our own charts, the forming triangles included
- Every timeframe from 1 minute to monthly
- Your own drawings and watchlists, saved to your account
- A feedback button straight to the team building it
- On your computer and your phone, in your members area
The beta is limited while we build it. Get TriTrader+ on this page and your seat is saved.
Everything you get today
Still like TradingView? The TriTrader+ indicator for TradingView is included too, for your own charts: all six triangles on any symbol, with alerts.
TRY IT FOR 30 DAYS
Use TriTrader+ for 30 days. If it is not for you, ask through Support in your dashboard and we refund you.
The questions I'd ask before buying this
What exactly do I get for $497?
TriTrader+ for life: TriTrader+ Live in your members area, the TradingView indicator, the Masterclass and the bonuses, plus the free Find Better Charts beta. One payment.
How do I get into the Find Better Charts beta?
It's switched on with your order. Open your members area and click Find Better Charts in the sidebar: it says you're in, and opens the charts.
Do I have to be glued to the screen?
No. TriTrader+ reads every chart as its daily and 4-hour candles close and posts the calls on TriTrader+ Live. Check it once a day and everything is waiting for you, with the levels.
Can I get the calls on my phone?
Yes. Right after checkout you get a one-time offer for TriTrader+ PRO Alerts: every call in a private Discord and Telegram room the moment it fires.
Will it cover the stocks I trade?
251 of the most-traded US stocks and ETFs, on the daily and 4-hour charts. On Find Better Charts and in the TradingView indicator, it draws the triangles on any timeframe.
Does every triangle work?
No. Plenty of triangles break and go nowhere, and some fail. That is why TriTrader+ waits for a close through the line and puts a stop on every call.
Is this a subscription?
No. One payment, lifetime access. No monthly or yearly charges.
What if it's not for me?
Use TriTrader+ for 30 days. If it is not for you, ask through Support in your dashboard and we refund you.
When do I get access?
Right away. Your access email arrives within a minute or two, and the thank-you page has a button straight into your members area.
P.S. One payment, lifetime access, every bonus included.
P.P.S. The Find Better Charts beta is free with TriTrader+ today (a $997 value). The beta is limited while we build it.