TRITRADER+
TriTrader+ reads 251 charts every time a daily or 4-hour candle closes, draws the six triangles I trust most, and the moment one breaks it hands you the whole trade: the entry, the stop and two targets for the shares, and the option I would buy if you trade options.
Let me open with a question.
What if you never had to draw another trendline?
No more squinting at a chart wondering if that's a real triangle or three random wicks. No more finding the perfect pattern the day after it broke. No more buying a breakout and having no idea where to get out.
What if you could log in, and the triangles that matter were already drawn for you, each one with the break, the entry, the stop, two targets, and even the option I would buy on it?
Calls like these, every one of them dated:
- JAN 2 · XOM Ascending Triangle at $122.65 (daily) — the stock ran +18%, the XOM Feb 20 $125 call ran +721%
- FEB 25 · NFLX Falling Wedge at $82.70 (daily) — the stock ran +25%, the NFLX Apr 17 $85 call ran +362%
- JAN 5 · CVX Symmetrical Triangle Buy at $163.85 (daily) — the stock ran +22%, the CVX Feb 20 $165 call ran +284%
And it hasn't stopped. Just recently, August 20, it called MSTR, and the MSTR Sep 18 $110 call ran +176%.
I know that might sound too good to be true.
So let me tell you who I am, and then I'll show you one of these calls, chart by chart.

My name is Ben. I've been part of building trading tools for close to a decade, me and a really great team: TriTrader+, MagniZone, the Morning Power Hour system, OCP, EFC, 5 Candle Master, Green Light Options and others thousands of traders have used.
And triangles have been my thing for a long time. I'm a chart nerd: the first thing I ever did on a chart was draw lines on it.
But here's the truth: anybody can draw a triangle on a chart. The hard part was never the drawing. It's knowing which triangles are real, catching the close that actually breaks one, and having the whole plan ready when it does.
That's the only thing TriTrader+ does. It reads every chart, at every close, and calls the few that pass its checks.
Don't take my word for it. Let me show you one.
The January 2 call
On January 2, TriTrader+ called XOM, on the daily chart.
Here's XOM on our own charts:
 TriTrader+ LiveXOMdailyAscending Triangle
The moment the daily candle closed through the line, TriTrader+ Live showed members this:
Look at what's on that card. The entry is the close. The stop sits under the triangle. There's a conservative target and an aggressive one, and the option I'd look at. Underneath, the checks it passed before it said a word.
No trendlines to draw. Nothing to measure. Nothing to guess.
And within 32 days…
Once it broke, XOM went from $122.65 to $144.80: +18%, all the way to the aggressive target.
Now here's the option that was on that card:
The XOM Feb 20 $125 call closed at $2.40 the day the call fired. The day the call finished, it closed at $19.71: +721%.
Every $1,000 in that option became about $8,210. That's why there's an option on every TriTrader+ call on the big names.
Watch it happen, candle by candle
Here's one of my favorite things we built into TriTrader+ Live. Every finished call has a Replay button. Press it and the call plays back candle by candle, the way you'd have seen it: the squeeze, the break, the targets, and the option on the card, priced every day.
Members can replay every call, wins and losses. Here are 6 from the last few months. Pick one and press play:
Real calls, real option prices (each day's close).
The receipts, first
Before the how, more of the what. Every one of these is a real TriTrader+ call, dated, drawn on our own charts, with the option that was on its card.
February 25. NFLX: a
For 30 trading days before the call, NFLX had been coiling inside a 22% range, both lines sloping down and squeezing together. On February 25 the daily candle closed through the line, and TriTrader+ called the Falling Wedge at $82.70. From there: +25% in 48 days. And the NFLX Apr 17 $85 call on the card? +362%.
TriTrader+ LiveNFLXdailyFalling WedgeEvery $1,000 in that option became about $4,620.
January 5. CVX: a
For 30 trading days before the call, CVX had been coiling inside a 6% range, the highs coming down and the lows coming up. On January 5 the daily candle closed through the line, and TriTrader+ called the Symmetrical Triangle Buy at $163.85. From there: +22% in 71 days. And the CVX Feb 20 $165 call on the card? +284%.
TriTrader+ LiveCVXdailySymmetrical Triangle BuyEvery $1,000 in that option became about $3,840.
February 6. ARM: a
For 30 trading days before the call, ARM had been coiling inside a 23% range, both lines sloping down and squeezing together. On February 6 the daily candle closed through the line, and TriTrader+ called the Falling Wedge at $123.70. From there: +45% in 74 days. And the ARM Apr 17 $125 call on the card? +254%.
TriTrader+ LiveARMdailyFalling WedgeEvery $1,000 in that option became about $3,540.
October 24. GOOG: a
For 30 four-hour candles before the call, GOOG had been coiling inside a 9% range, the lows climbing into a flat ceiling. On October 24 the 4-hour candle closed through the line, and TriTrader+ called the Ascending Triangle at $261.82. It went to its aggressive target, and the GOOG Nov 21 $260 call on the card ran +175%.
TriTrader+ LiveGOOG4-hourAscending TriangleEvery $1,000 in that option became about $2,750.
And the big names, lately
The names you already trade. Each one is the newest TriTrader+ call on it that reached a target:
- NVDAAscending Triangle · Oct 2stock +3.7%
- IONQSymmetrical Triangle Buy · Sep 23stock +8.3%
- MUAscending Triangle · Sep 21stock +5.5%
- INTCSymmetrical Triangle Buy · Sep 17stock +10%
- GLDDescending Triangle Buy · Aug 5stock +3.4%
- SNOWAscending Triangle · Jul 29stock +22%option +109%
- COINFalling Wedge · Jul 15stock +9.1%
- DKNGDescending Triangle Buy · Jun 1stock +13%
- MSFTAscending Triangle · May 29stock +3.3%
Some calls get stopped out too, and the scorecard inside keeps every one of them.
I was missing the best trades of my life
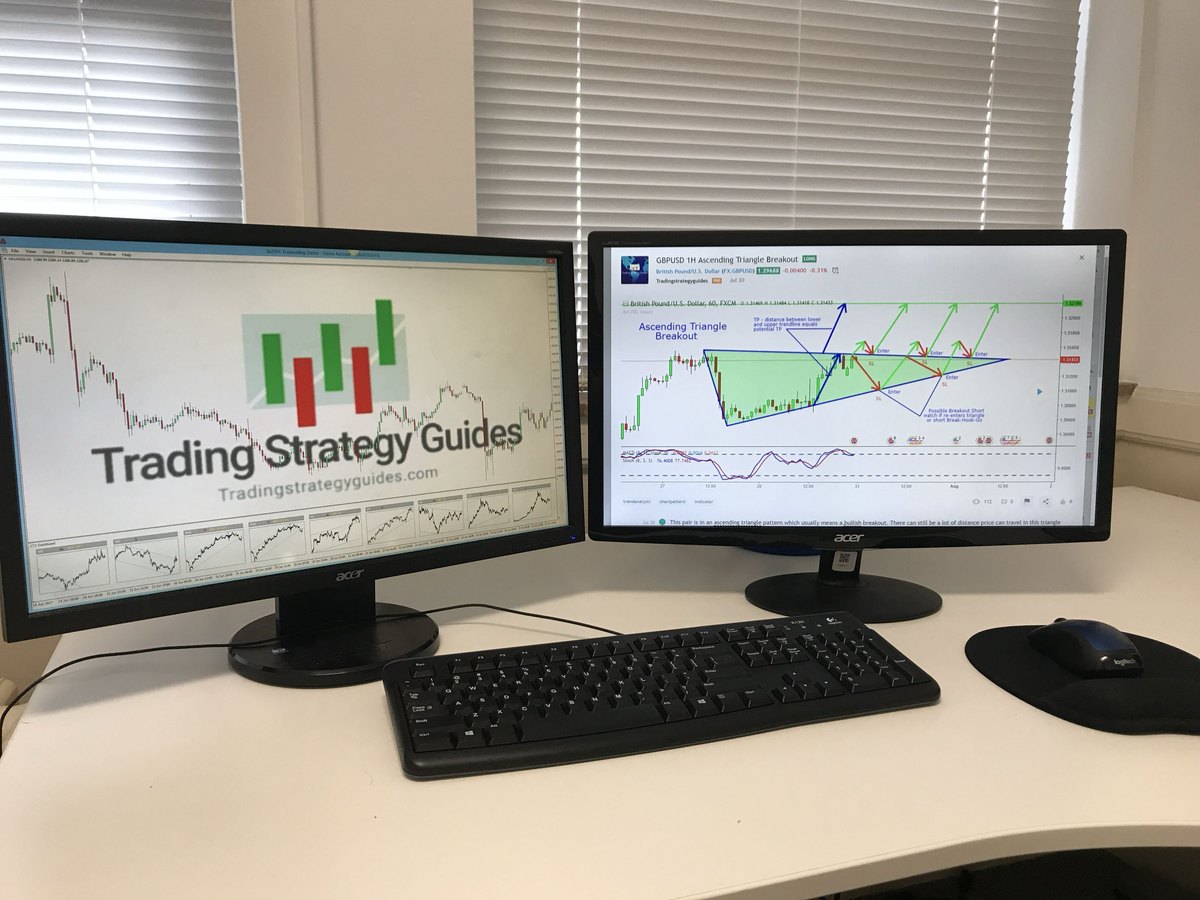
This is me in 2017, at my desk in the old Trading Strategy Guides office, with an ascending triangle on GBP/USD drawn on the screen by hand. Every trendline, every touch, one at a time.
I loved that pattern then and I love it now. The problem was never finding them. Here's what kept happening:
I'd open a chart and see it clear as day. A perfect triangle. Clean trendlines, tight compression, an obvious breakout coming.
And by the time I checked back on it, the move had already happened. Like this one on AAPL, back in July 2024:

I wasn't missing these because I didn't know how to find them. I was missing them because I didn't have time to catch them. Too many tickers, too many timeframes, real life in between.
With TriTrader+ on the chart, that breakout is drawn as it happens:

So I took the six triangle patterns I trust most, the ones that lead to real trades and real follow-through, and built an algo that finds them for me. I call it the TriHex Algo.
Stories from the charts
A couple of my favorites from the TriTrader+ indicator on TradingView, the version you get too.
TSLA, a Descending Wedge. The big vertical

Pretty easy, right? Take the signal, buy the stock or the option you prefer, and you are lined up for the breakout:

And NVDA, a textbook Symmetrical Triangle.


Every one of those lines was on the chart before the move. That's the whole idea, and it's exactly what TriTrader+ now does for you on every chart, at every close.
OK, so why doesn't everybody trade triangles?
Here's the question I'd be asking in your seat. Triangles are in every trading book. Every charting app lets you draw one. So why do so many traders lose money on them?
I've watched it for close to a decade, and it comes down to 4 things:
Triangles everywhere. Squint hard enough and any three wicks look like a triangle. Most of them aren't. Trade the fake ones and you bleed.
Breaks that fake you out. Price pokes through the line at 11 AM, you buy, and by the close it's back inside. A wick isn't a breakout. A close is.
No plan. You caught the break. Now what? Where's the stop? Where do you take profit? Without the plan, a good trade turns into a coin flip.
Not enough hours. Even if you read one chart perfectly, there are 251 worth reading, on 2 timeframes, and the candle that matters closes while you're at work.
So let me say it plainly: the triangle was never the problem. Reading it, on every chart, at every close, with the plan ready, was.
The TriHex Algo
So I built TriTrader+ to do the reading for you. The brain behind it is the TriHex Algo: built from the ground up to find the exact structure that makes a triangle work.
It runs on the daily and 4-hour charts of 251 of the most-traded US stocks and ETFs, every time a candle closes. Here's exactly what it does:
Finds the anchors.
It marks the real swing highs and swing lows: a high with lower candles on both sides, a low with higher ones. No guessing which wick counts.
Draws the lines.
A line through the swing highs and another through the swing lows, locked to the candle highs and lows with the 0.0001 precision factor. A line only stands if price respects it, and the two lines need at least five touches between them.
Names the shape.
From how the two lines slope, it knows which of the six triangles it is looking at.
Waits for the close.
No call until a candle closes through the line, not just pokes through it. On the daily it wants a decisive close, a triangle tall enough to matter, and a rising market.
Hands you the plan.
The entry at the close, the stop under the lower line, a conservative target where half comes off and the stop moves to your entry, and an aggressive target at the triangle's own height.
Every call that clears all five gets the TriHex Algo confirmed stamp. In the last 30 days it made 42 new calls. On a quiet day that means fewer calls, not filler.
The six triangles it reads:


Why it only calls the buys
Here's something most indicator sellers won't tell you. We tested the sell side. A lot.
Nate on our team ran over 2 million backtests on triangles. Not one short version was profitable. Then we ran our own on top: more stocks, the 1-hour, quick 15-minute trades, one- and two-day holds, only on days the market was falling. The best version made about +0.05R a trade. That's a coin flip once you pay to trade it.
The reason is simple: the market rips. Stocks climb over time, and when one breaks down, buyers step in and snap it back.
So all six triangles are drawn on your charts, the sells included, so you see the whole picture. But TriTrader+ only calls the side that has paid: the buys. These are our best setups, and we're not going to mess with anything else just to look busy.
And I want to be straight with you, because it's the only way I know how to do this. There's no guarantee in trading. A stock can close through the line and fall right back inside the triangle. What I can give you is structure: the five steps above, a stop on every call, the conservative target that turns the rest into a free trade, and a scorecard that keeps every result, wins and losses.
Why this beats drawing it yourself
You stop hunting. TriTrader+ reads 251 charts on 2 timeframes at every close. You open one page and the calls are already there.
You get the whole plan, not a hint. Entry, stop, a conservative target and an aggressive one, on every call. Take half at the conservative target, move your stop to your entry, and the rest of the trade can't turn into a loss.
You see it coming. The Forming list shows the triangles in place that haven't broken yet. That's tomorrow's watchlist, made for you.
You get my picks. My Top Triangle Picks sit right up top: the cleanest triangles on the board, and why I like each one.
You get the option too. Every call on a big name shows the at-the-money option I would look at, priced from the close it fired on.
You can check every call. The scorecard keeps every result, wins and losses, and you can replay any of them candle by candle.
What you actually get: TriTrader+ Live
Here's the product. Log in and my Top Triangle Picks are waiting right up top, the way members see them today:
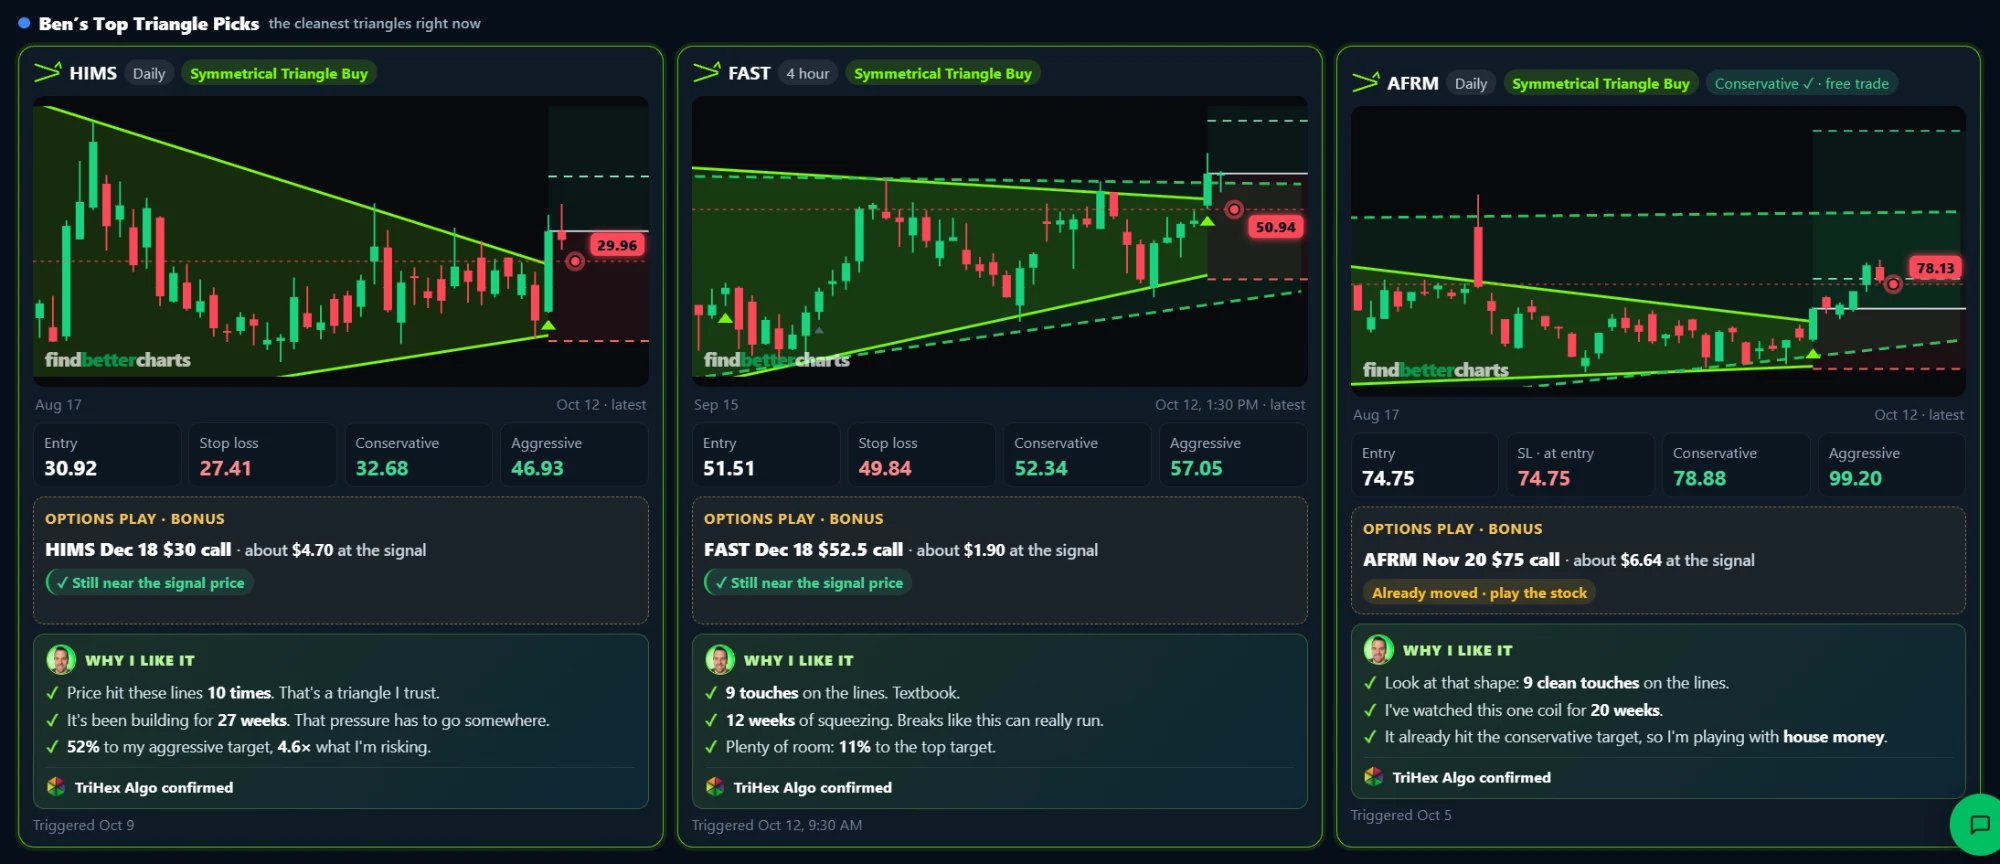
Every pick has the chart, the entry, the stop, a conservative and an aggressive target, the options play on the big names (and whether it is still near the signal price), why I like it, and the TriHex Algo confirmed stamp.
Under the picks, the whole board. These are real calls from the scanner right now:
- Grab a cup of coffee.
- Open TriTrader+ Live.
- Read my Top Triangle Picks, then the Forming list.
- Take the ones you like: the stock, or the option on the card.
Done before the opening bell.
And coming soon: our own charts

Ever since I started trading I've wanted one thing: our own charts. Not borrowed. Not rented. Ours, with our systems built right into them. Me and the team are building it right now, and I'm in there every single day making it better. It's called Find Better Charts.
Here's a sneak peek, with a TriTrader+ call drawn on it:
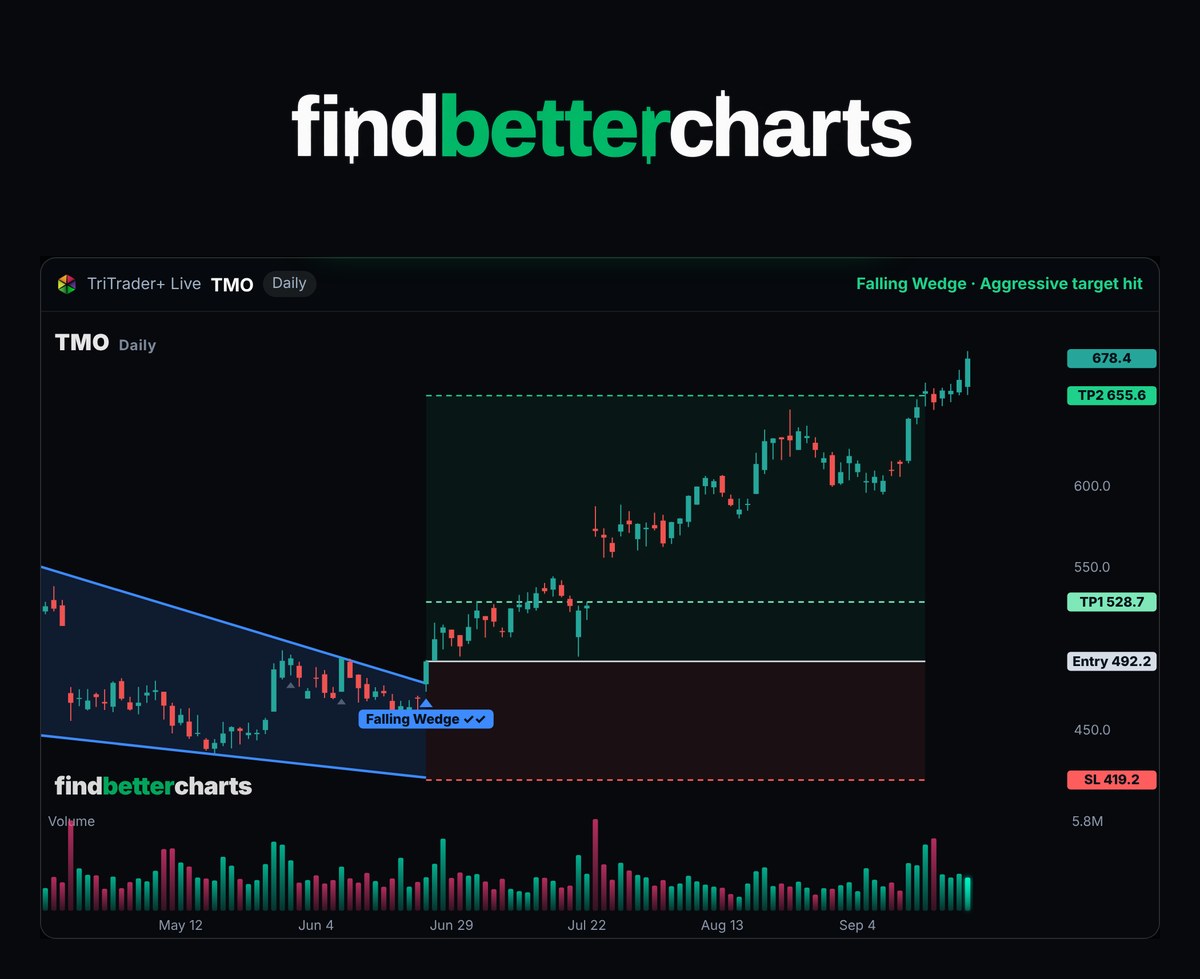
Get TriTrader+ in this drop and you get first access to the beta when it opens, before everyone else. TriTrader+ will be on it from day one.
Just the shares: the fast movers
Some names move fast enough that the stock alone is the trade. SMCI, AVGO, MSTR, SLV, NBIS: when one of these closes through its line, buying the shares at the close and selling at the targets has been plenty.
Here are the biggest share moves from TriTrader+'s finished calls this past year, one per stock:
| Call | Called | Shares: entry → target | Stock move | Days |
|---|---|---|---|---|
| SMCI daily | May 6 | $34.66 → $44.38 | +28% | 35 |
| AVGO daily | Apr 8 | $350.63 → $442.01 | +26% | 36 |
| MSTR 4-hour | Aug 20 | $111.67 → $139.40 | +25% | 7 |
| SLV 4-hour | Nov 28 | $51.20 → $60.14 | +17% | 19 |
| NBIS 4-hour | Mar 11 | $112.04 → $124.57 | +11% | 15 |
| PLTR daily | May 28 | $143.34 → $156.88 | +9.4% | 6 |
| COIN daily | Jul 15 | $167.21 → $182.45 | +9.1% | 63 |
| NVDA 4-hour | Oct 2 | $234.30 → $242.96 | +3.7% | 6 |
Every call's stock result, the ones that hit the stop included, is on the scorecard inside TriTrader+ Live.
BONUS: the TriTrader+ Options Plays
First, so nobody gets the wrong idea: you don't have to trade options. Every TriTrader+ call is a plain stock trade first. Buy the shares at the entry, the stop sits under it, sell at the targets. That works in any account, IRA included.
The option is the extra, for those who want it. Here are my rules, so you know exactly what you're looking at:
A call option on a Buy.
Every TriTrader+ call is a buy, so the play is a call.
At the money.
The listed strike nearest the entry price.
A monthly expiry 60 to 90 days out.
So the triangle has time to play out.
Only on the big names.
The big, heavily traded stocks, where the options market is real.
Some of the best finished plays so far:
| Call | The option | Signal → exit | Option price | Move |
|---|---|---|---|---|
| XOM daily | XOM Feb 20 $125 call | Jan 2 → Feb 3 | $2.40 → $19.71 | +721% |
| NFLX daily | NFLX Apr 17 $85 call | Feb 25 → Apr 14 | $4.60 → $21.25 | +362% |
| CVX daily | CVX Feb 20 $165 call | Jan 5 → Mar 17 | $4.86 → $18.65 | +284% |
| ARM daily | ARM Apr 17 $125 call | Feb 6 → Apr 21 | $11.43 → $40.47 | +254% |
| MSTR 4-hour | MSTR Sep 18 $110 call | Aug 20 → Aug 27 | $10.50 → $28.99 | +176% |
| GOOG 4-hour | GOOG Nov 21 $260 call | Oct 24 → Nov 19 | $13.18 → $36.30 | +175% |
| JPM 4-hour | JPM Jul 17 $310 call | Jun 4 → Jul 14 | $12.23 → $31.85 | +160% |
| GOOGL 4-hour | GOOGL Nov 21 $260 call | Oct 24 → Nov 19 | $12.85 → $33.32 | +159% |
Real option closes from the signal's session to the exit's. Every call's option, winners and losers, is on its card inside TriTrader+ Live.
Still like TradingView? It's included
From November 1, TradingView changes its rules for indicators sold outside its own Marketplace, and it can change them again whenever it wants. That's why TriTrader+ Live runs on our own platform, where nobody can switch it off on us.
You still get the TriTrader+ indicator for TradingView, with its 1-minute install guide and the alert setup, for your own charts: all six triangles drawn on any symbol and any timeframe, with BUY and SELL alerts.

Everything you get
- TriTrader+ Live NEWThe scanner on our own platform: the six triangles on the daily and 4-hour charts, calls with the entry, the stop, a conservative and an aggressive target, my Top Triangle Picks, the Replay and the record of every result.
- First access to Find Better Charts COMING SOONOur own charting platform, coming soon. Get TriTrader+ in this drop and you get into the beta before everyone else.
- TriTrader+ Indicator for TradingViewThe core engine. Add it to your charts in about a minute and it draws all six triangle patterns for you — any symbol, any timeframe.
- Built-in live chart alertsPick the patterns you care about. When a setup is confirmed and price presses on the breakout level, TradingView alerts you — desktop, phone or email.
- 1-Minute Quick-Start Install GuideA no-fluff walkthrough from zero to live setups, even if you have never used TradingView.
- TriTrader+ Masterclass video trainingHow the system is built: what each structure is telling you, why it picks its anchor points, how breakout levels are calculated, and how to plan a trade around the setup.
- Pattern Cheat Sheet BONUSThe anatomy of all six triangles on one page — where pressure builds, how momentum shifts, and the breakout zones the system watches.
- TradingView 101 course BONUSOpen a free TradingView account, load the indicator, lay out your chart like ours and switch on alerts — in under 10 minutes.
- Triangle Secrets LIVE (recordings) BONUSBen walks through the cleanest triangle breakouts he has graded — what made them "A" setups, how the system picked them up, and how to spot one in seconds.
- NEW: the Live Status dashboard BONUSThe panel on your chart now spells out the active setup, its direction, and the target and stop levels the moment a signal fires.
The offer
Lifetime is $277, or two full years for $177, until the Indicator Bonanza closes on October 31.
14-day money-back guarantee, no questions asked.
One payment. No monthly charges. And measure it against one dated call: on January 2, every $1,000 in the XOM Feb 20 $125 call became about $8,210 in 32 days. One call like that, one time, covers the price.
14 DAYS, NO QUESTIONS ASKED
Use TriTrader+ for 14 days. If it is not for you, ask through Support in your dashboard and you get every penny back. No questions asked.
What "no thanks" actually costs
Two true things:
One, about your wallet: the Bonanza price ends October 31. After that TriTrader+ goes to full price, like everyone else pays.
Two, about the market: TriTrader+ reads the next candle close whether you're on it or not. In the last 30 days it made 42 calls. When the next triangle breaks, it's either a card on your screen at the close, or a chart you look at a week later with the move already over. You've lived that second version before.
Still not convinced? Good. Here's the last month.
Every TriTrader+ call that reached a target in the last 4 weeks, on the calendar day it was called:
Read the empty days too. Some days nothing passes the checks, and some calls get stopped out: every call has a stop for exactly that reason, and the scorecard inside keeps every result, wins and losses.
The questions I'd ask before buying this
Do I have to be glued to the screen?
No. Calls fire when a candle closes: the daily ones at the 4:00 PM ET close, the 4-hour ones during the day. Open TriTrader+ Live once after the close and everything is waiting for you.
Can I get the calls on my phone?
Yes. Add TriTrader+ PRO Alerts after checkout and every call lands in a private Discord and Telegram room the moment it fires, with the chart and the whole plan.
By the time a call posts, am I already late?
The entry is the close the call fired on, and that is when it posts. Every result on this page, the options included, is measured from that close.
Will it cover the stocks I trade?
251 of the most-traded US stocks and ETFs, on the daily and 4-hour charts. And the TradingView indicator draws the six triangles on any symbol you like.
Small account?
Trade the shares, or the option. The XOM Feb 20 $125 call above cost $2.40 a share, or $240 for one contract.
And the calls that don't work?
Some get stopped out. Every call has a stop for exactly that reason, and the scorecard keeps every result, wins and losses. This page shows the best ones; inside, you see all of them.
Do I still get the TradingView indicator?
Yes. The TradingView version, its 1-minute install guide and the alert setup are on the TriTrader+ page in your dashboard.
Do I get Find Better Charts?
It is coming soon. Get TriTrader+ in this drop and you get first access to the beta when it opens.
Is this a subscription?
No. Either plan is one charge, once: Lifetime is $277, for life; 2-Year Access is $177, for 2 full years of access, and it never renews or charges again. No monthly or yearly charges.
What if it's not for me?
Use TriTrader+ for 14 days. If it is not for you, ask through Support in your dashboard and you get every penny back. No questions asked.
When do I get access?
Right away. Your access email arrives within a minute or two, and the thank-you page has a button straight into your members dashboard.
Two versions of the next XOM
Some day soon, a stock will squeeze into a tight triangle and close through the line with the market behind it.
In one version, you find out the way you always have: a few days later, scrolling, with that familiar feeling of "it was right there."
In the other version, it's a card on your screen at the close: the entry, the stop, both targets, and the option.
TriTrader+ reads the next close either way. The only question is whether you're reading it with me.
P.S. Your login works within a couple of minutes of ordering, and the next calls post at the next candle close.
P.P.S. You get the TradingView indicator too, with its install guide and the alert setup.
P.P.P.S. Find Better Charts is coming. Get TriTrader+ in this drop and you're first in when the beta opens.
P.P.P.P.S. 14 days, no questions asked. If TriTrader+ isn't for you, ask through Support in your dashboard.