Scary good trades
Every scare this fall, Slingshot was ready.
When the AI bubble was supposedly ready to pop, when earnings missed and outlooks were cut, good stocks dropped hard. And on stock after stock, Slingshot waited through the drop, then caught the bounce. Watch them play out:
Jul 17: an AI model designed a chip by itself, and chip-design software sold off
Slingshot Buy Jul 22 at $377.29 → target Jul 27, +3.0%
Jul 17: beat on earnings, but slower U.S. growth and no raised outlook
Slingshot Buy Jul 29 at $355.58 → target Aug 3, +3.0%
Jul 14: a weak second-quarter preview, its worst day since at least 1968
Slingshot Buy Aug 12 at $233.84 → target Sep 9, +3.0%
Jul 23: an earnings miss and its first cash burn in two years on AI and robot spending
Slingshot Buy Aug 12 at $325.98 → target Aug 13, +3.0%
Early August: a record quarter, but a weaker outlook and rising memory-chip costs
Slingshot Buy Aug 12 at $301.50 → target Aug 19, +4.0%
Aug 17: the AI-bubble scare, a Morgan Stanley warning that AI revenue lags AI costs
Slingshot Buy Aug 17 at $480.02 → target Aug 26, +3.5%
All summer: worries its $125 to $145 billion of AI spending this year will not pay off
Slingshot Buy Aug 17 at $567.17 → target Aug 26, +3.0%
Sep 10: record revenue and a raised outlook, and it still fell on AI worries
Slingshot Buy Oct 2 at $237.64 → target Oct 9, +3.0%
Real Slingshot calls from our record, each finished at its target, the catalyst as it was reported at the time. The line is the stock's closes, smoothed a little so the shape reads at a glance. Hand-picked stories, not the whole record: the record, stops included, is further down.
Back to back to back…
Here's the longest winning run in Slingshot's record: 56 finished calls in a row closed in profit, from August 5 to August 17. Counted in the order the calls finished, across every stock it called; the run ended with the next call that didn't close in profit.
- SCHWAug 5+3.0%
- AMGNAug 5+3.0%
- XRTAug 5+3.0%
- ABNBAug 5+3.0%
- PFEAug 6+3.0%
- WFCAug 6+3.0%
- ROKUAug 6+3.0%
- KDPAug 6+3.0%
- METAug 6+3.0%
- PAYXAug 6+3.0%
- ROPAug 7+3.0%
- TMOAug 7+3.0%
- CPRTAug 7+3.0%
- GDAug 7+3.0%
- COPAug 10+3.0%
- MDTAug 10+3.0%
- LMTAug 10+3.0%
- BIIBAug 10+3.0%
- FTNTAug 10+3.0%
- ABTAug 10+3.0%
- BABAAug 10+3.0%
- TGTAug 10+3.0%
- XOMAug 10+3.0%
- JNJAug 11+3.0%
- XLEAug 11+3.0%
- TMUSAug 11+3.0%
- MRKAug 12+3.0%
- CSCOAug 12+3.0%
- WBDAug 13+3.0%
- SBUXAug 13+3.0%
- USBAug 13+3.0%
- COFAug 13+3.0%
- CMCSAAug 13+3.0%
- MARAug 13+3.0%
- BIIBAug 13+3.0%
- NFLXAug 13+3.0%
- QQQAug 13+3.0%
- SHOPAug 13+3.0%
- TSLAAug 13+3.0%
- FDXAug 13+3.0%
- +16more in the run
And on one stock: WFC, 8 Slingshot calls in a row closed in profit, from June 25 to October 9: Jun 25 +3.0%, Jul 2 +3.0%, Jul 14 +3.0%, Aug 6 +3.0%, Sep 11 +3.0%, Sep 15 +3.0%, Oct 5 +3.0%, Oct 9 +3.0%.
The best runs, not the usual: the whole record, stops included, is below. A run always ends.
This is all thanks to our biggest breakthrough yet: the Slingshot Indicator
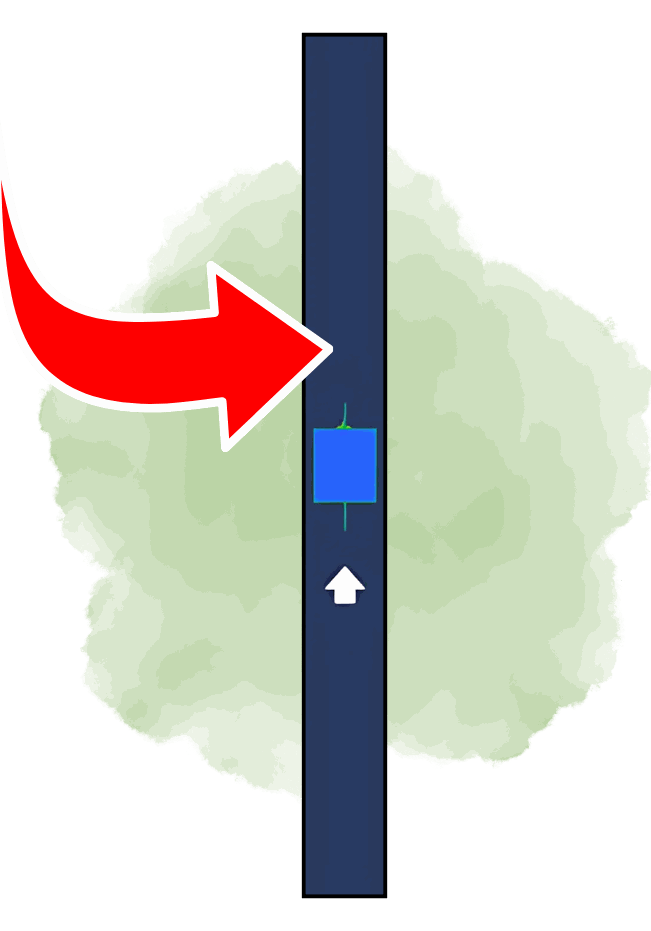
What you're about to see is a new way that lets anyone trade some of the most popular stocks by simply following the blue candle.
It might look simple. But when that candle lights up bright blue, it unlocks our #1 setup, with the target and the safety net already on your chart.
And it's all thanks to the three-step process Slingshot uses to find hidden momentum:
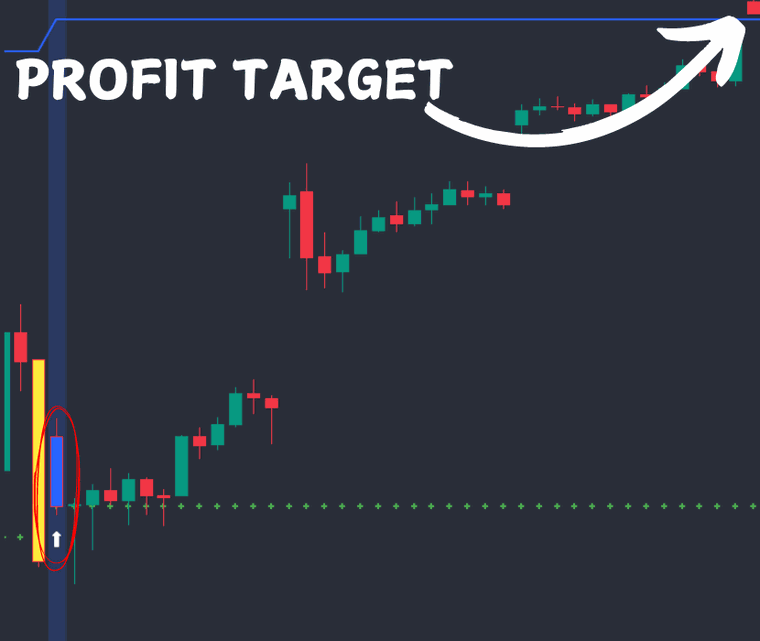
Those three steps call trades on some of the world's most popular tickers, like $AAPL, $QQQ and $GLD, and a whole lot more.
Let me show you how it works
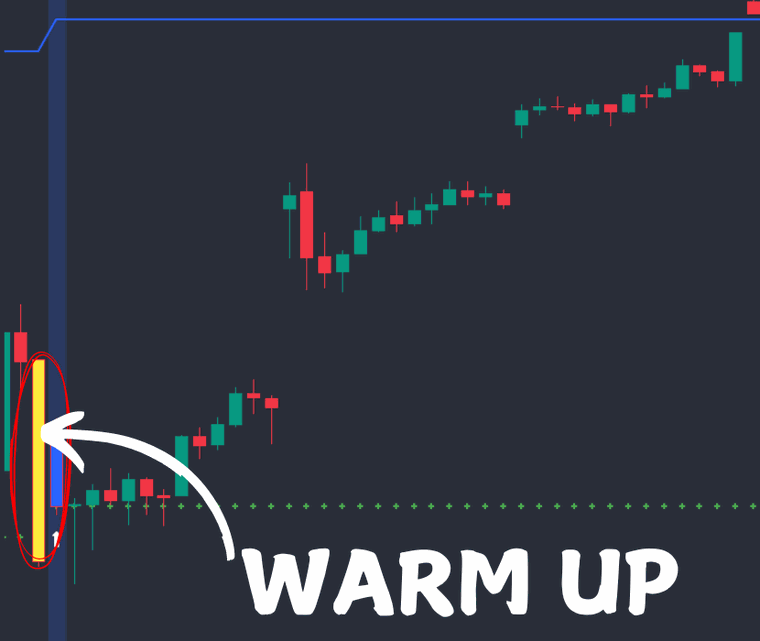
Step #1: the yellow candles. The first coloured candles you'll see are yellow. They're the "get ready" signal: the Slingshot is engaged but not fired yet. The stock has pulled back until it reads oversold, and a trigger could come within a few candles.
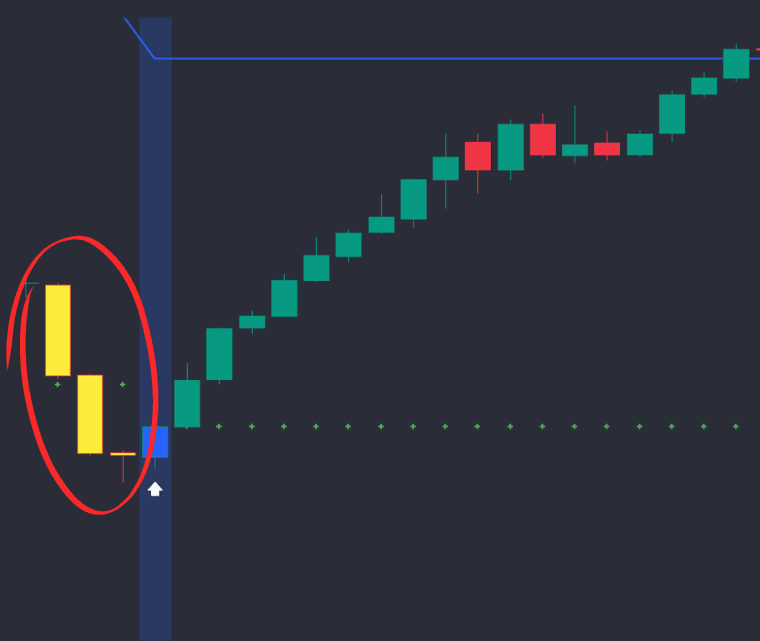
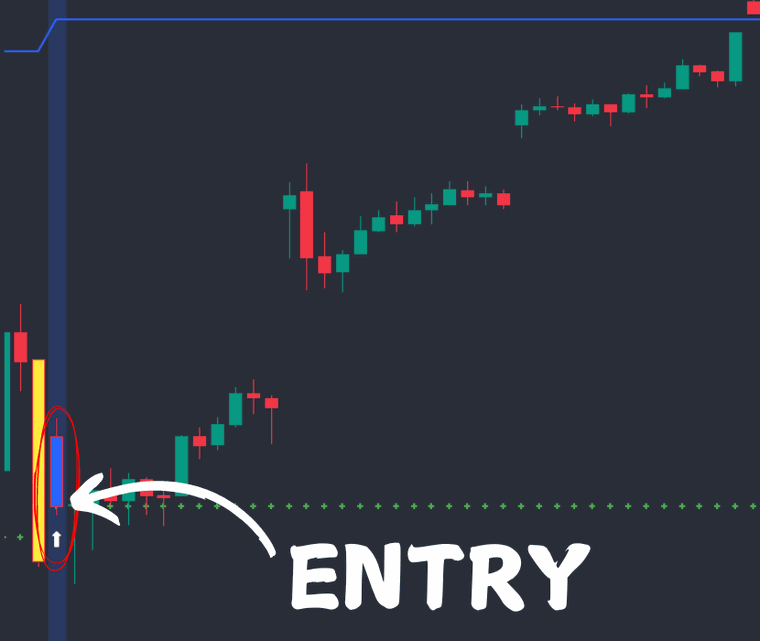
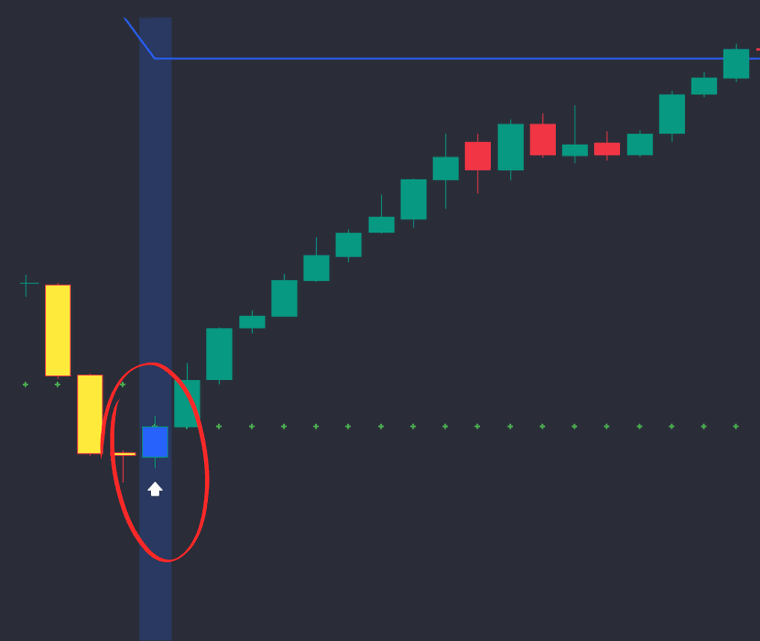
Step #2: the blue candle with the up arrow is the entry. A candle closes back over the high of the one before it while the stock is still oversold. It's that simple: when you see the blue candle light up with the blue band over it, the Slingshot has fired.
Step #3: the target line, and the red safety net. If price reaches the target line, which is how 81% of finished calls ended in profit: congratulations, you just won a Slingshot trade.
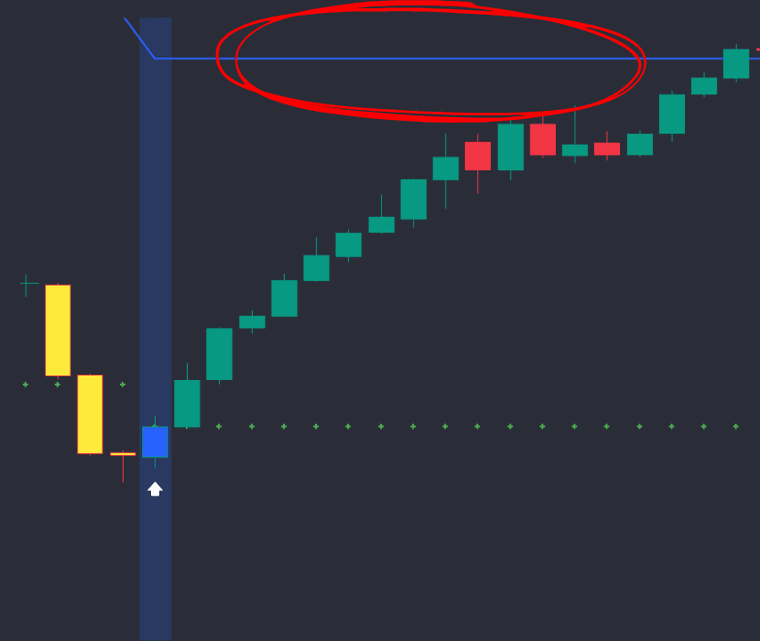
We also always have a safety net in place, for a sell-off or bad news. It's wide on purpose, so a normal wobble doesn't shake you out. About 19% of finished calls didn't close in profit; that's what the net is there for.
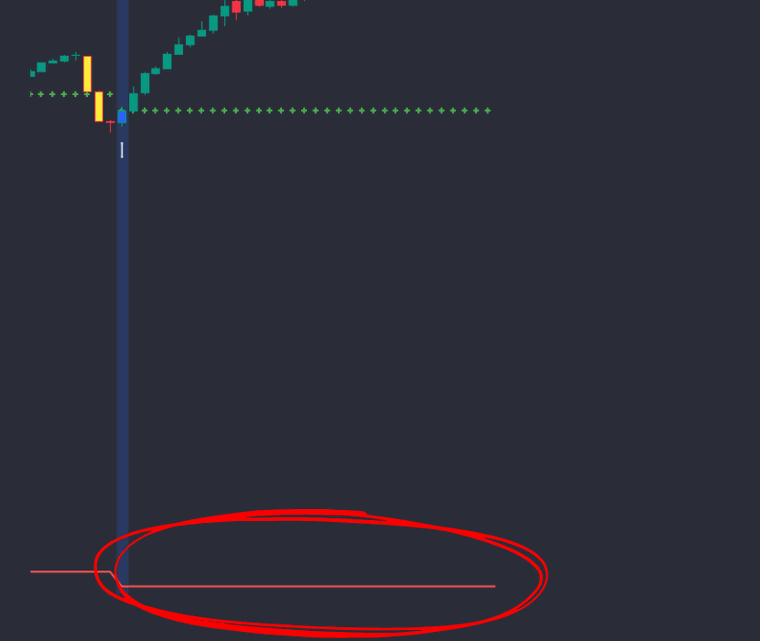
Let's watch it in action
Here's a real one: Costco on the 30-minute chart. Step #1: the candles turn yellow.
The Slingshot is engaged. We're just waiting for the bright blue candle to take action. On August 20 it came, and this is the card:
The exit lines are already on the chart, so Step #3 is just waiting for price to move toward the target. And sure enough…
Costco pulled back for 5 yellow candles. On August 20 a candle closed back over the one before it at $933.23: the blue candle, and Slingshot Live called the buy. The target sat at $975.23. It got there in 55 days: +4.5% on the stock. That's a win in three simple steps.
$97 once · lifetime · 14-day money-back guarantee
How it works: hidden momentum
The Slingshot Indicator is built to find hidden momentum. Most people either guess when a pullback is over, or chase a move after it's too late. Slingshot uses specific criteria to catch the continuation before most people know the stock is moving.
The first is the Snap Zone: a tiny warming-up zone where price is pulling back while the bigger trend is still intact. You won't see it with the naked eye, because the candles are red. That's why we call it hidden momentum.
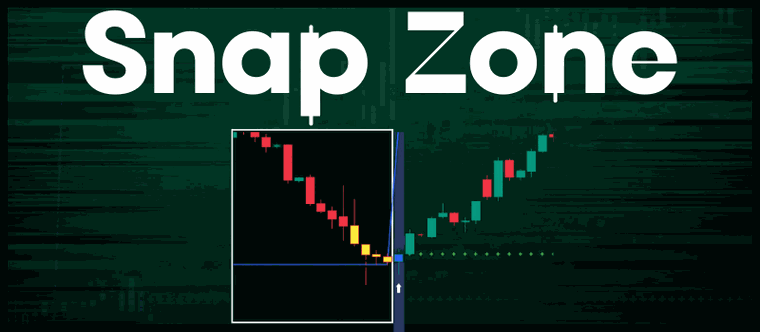
And to make it extra easy, the indicator shows the exact target and safety net right at the top of the chart. That way you always have a trading plan.
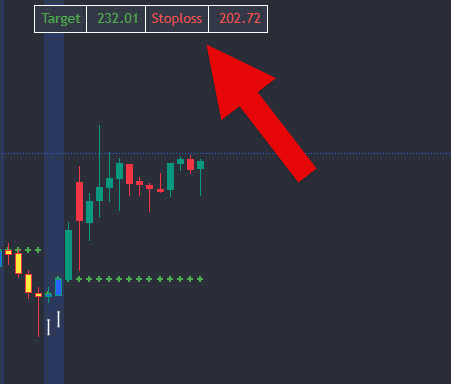
Behind the blue candle are three simple rules: a calm, steady stock (a wild chart is drawn, never called), a custom oversold level for each stock, and the first close back over the last candle's high. Yellow means it's in the pullback range. Blue means the turn is in.
Multiple signals in a short period? That's a good thing
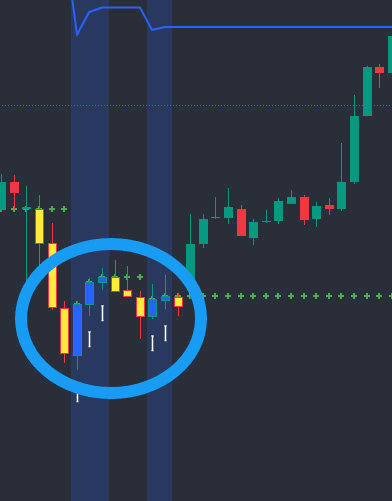
If Slingshot gives you a few blue candles close together, it's building up. Think of them as multiple confirmations of the same trade: Slingshot takes one trade per chart at a time, so the first one is the call.
The 30-minute chart is the sweet spot
Through testing, we found the 30-minute chart is where Slingshot works best: fast enough to catch short-term moves, not so quick that you drown in noise. It's the only chart it calls on; on any other you'll see its candles for context, never a call.
The record, straight
Now, we're not here to tell you every Slingshot will be a home run. Some winners are bigger, some smaller, and of course some miss. So here's every finished Slingshot call, wins and losses, as our engine kept it, in percent on the stock:
Slingshot's strength is how often it's right, and how often it calls. But the target is small and the safety net wide (about +3.0% up against −10.0% down), so one stop can cost about what several targets make. Over the last 3 months the hit rate was 75% and the average call came out at −0.31%: the stops cost about what the targets made. This isn't a get-rich system. It's a frequent, high-hit-rate dip-buyer for traders who size it small and pick the calls they like.
Here's how the hitlist names have done since our engine started keeping score:
| Ticker | Finished calls | In profit | Average call |
|---|---|---|---|
| QQQ | 3 | 100% | +3.00% |
| XLK | 3 | 33% | −1.17% |
Right now 103 calls are still open. They're in none of these numbers: an open call is never counted as a win.
Counted from the record when this page loaded: every finished call, scored from its entry to its exit, the stops included. No magic eight ball: past results are not a promise about the next one.
With Slingshot on your side…
- No more chasing bad setups.
- No more confusing yourself with too many data points.
- No more buying the first red candle of a pullback.
- No more guesswork: the entry, the target and the safety net on every call.
Don't even watch your charts
Load Slingshot on TradingView in a few clicks and you're ready. But it's even easier now: with the new Slingshot Alerts, you get every signal without looking at a chart at all. Follow along from any brokerage account you like.
- Real-time entry alerts: the moment it triggers, at the candle close.
- Ticker and entry price: so you know exactly what to trade.
- Exit prices: the target and the safety net on every alert.
- Trade updates: how every call ended.
They post in the new Slingshot Alerts room in Telegram and Discord, which you join from your members area. The FBT App is coming soon.
And the 5-minute charts, on our own platform
Every Slingshot owner now gets into Find Better Charts, our own charting platform, while it's still in beta: Slingshot and our other systems on fast, clean charts, from the daily down to the 5-minute.
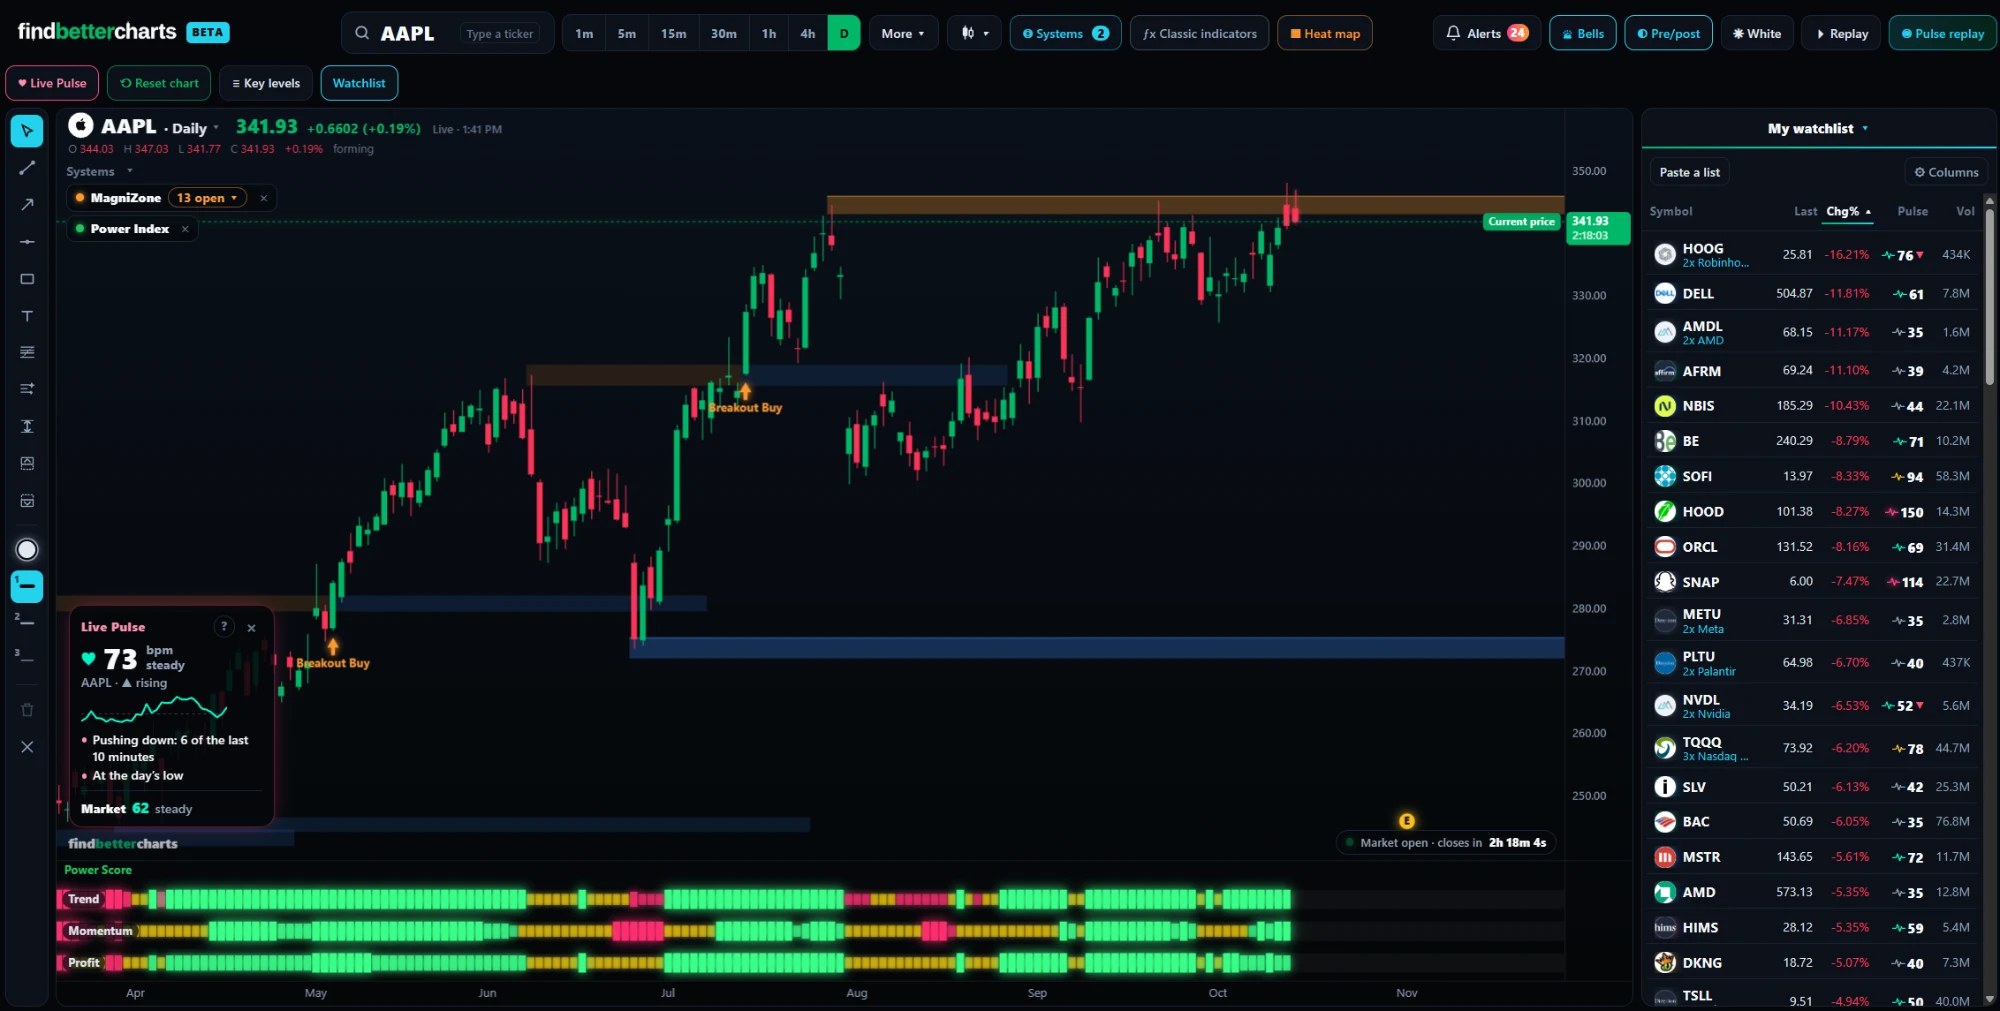
Here's what you get
Slingshot Live and on TradingView
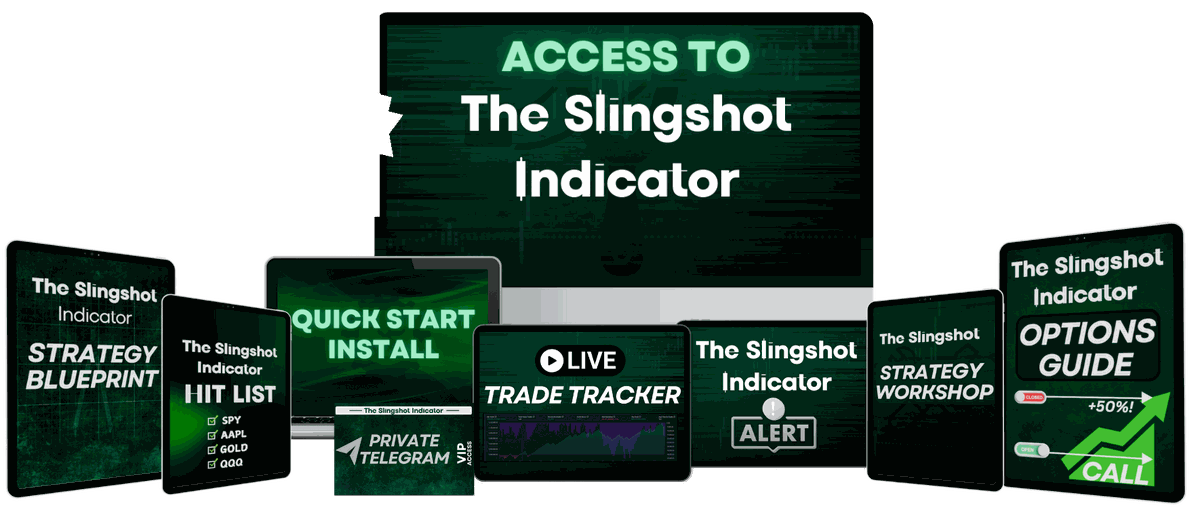
Slingshot Live in your members area: every Slingshot Buy on every stock and ETF we scan, with the entry, the target and the safety net. And the Slingshot indicator on TradingView, so you can apply it directly to your charts and get the signals in real time.
The Slingshot Strategy Blueprint
A clear roadmap to the strategy behind the Slingshot Indicator.
The Quick Start Install Guide
How to add the indicator on TradingView. It takes zero technical skills: if you have an email, you can be set up in under a minute.
The Slingshot Strategy Workshop
The video walk-through: how Slingshot looks on the charts, the markets it works on, and why it does not repaint.
But we aren't done yet. The special bonuses:
The VIP private Slingshot Telegram channel
Hang out with us: favorite trades, videos and more. Joined from your members area.
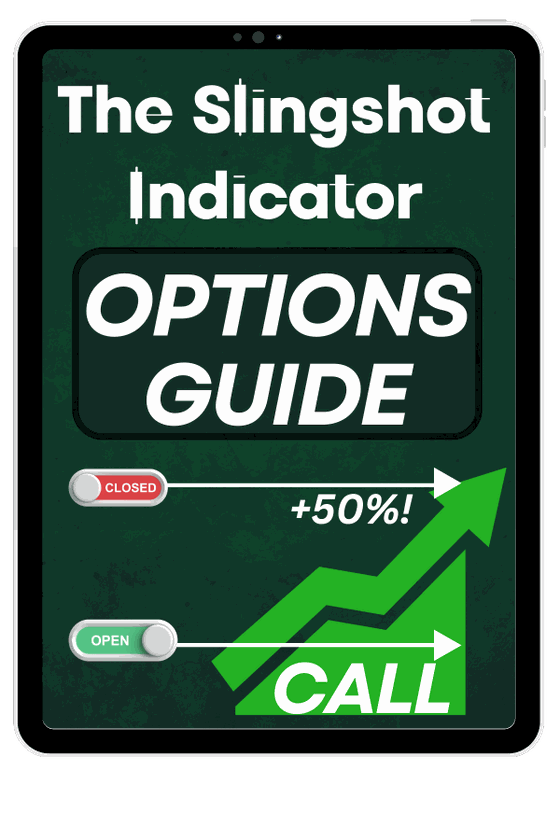
The Slingshot Options Guide
The options side of Slingshot: which call option to take, which expiration, and the entry and exit.
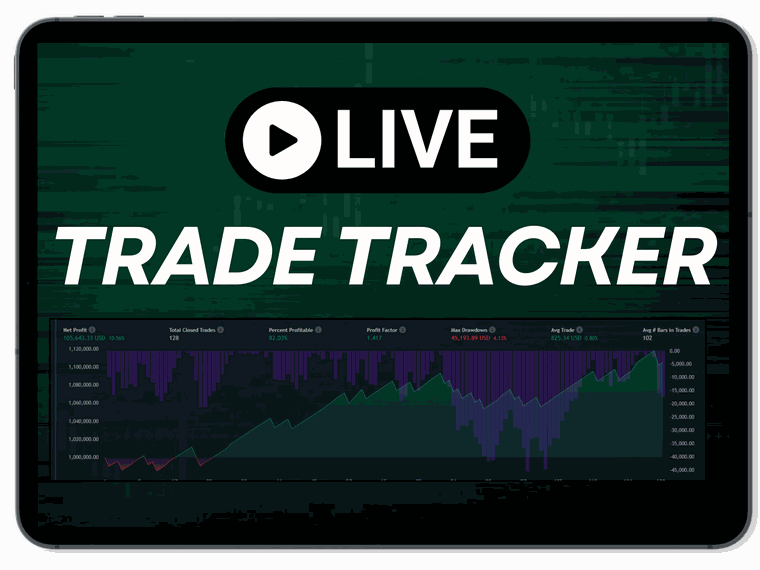
Backtest Slingshot on the charts
Scroll back on any chart and see every signal it gave, and the scorecard and the Replay of every call in Slingshot Live.
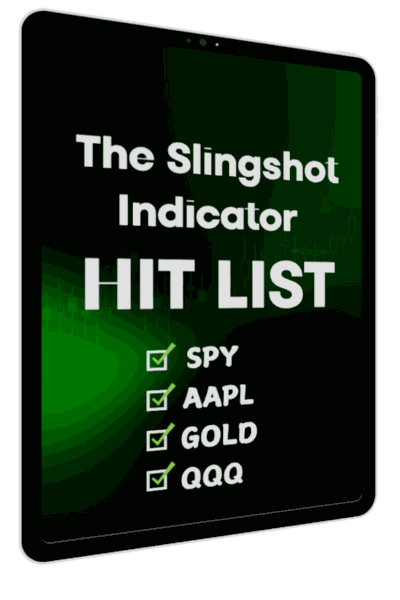
The Slingshot Hitlist
The names the original Slingshot was tuned on, each with its own settings.
🎃 And new this Halloween
Slingshot Alerts NEW
Every Slingshot Buy the moment it is called on the 30-minute chart: the ticker, the entry, the target and the safety net, then how it ended. In the new Slingshot Alerts room in Telegram and Discord, joined from your members area. The FBT App is coming soon.
Slingshot · COST Slingshot Buy (30-minute)
Entry $933.23
Target $975.23 (+4.5%)
Safety net $783.91 (−16.0%)
A real call, as the alert reads.
Find Better Charts, beta access NEW
Our own charting platform before it opens to everyone: Slingshot and our other systems on fast, clean charts, down to the 5-minute chart. Open it from your members area the moment you are in.
The Slingshot Field Guide NEW
The whole setup from the yellow warm-up to the target, what the record says to expect in percent, and finished winners on our own charts.
The Repeat-Winner Watchlist NEW
The stocks Slingshot has called and closed in profit most often in our record, each with its history, and which has a call open right now.
The Slingshot Position Sizer NEW
Your account and your risk in, the shares out: sized to the wide safety net, so one stop never costs more than you planned.
The Scare Sheet HALLOWEEN
The eight scares of the fall Slingshot bought into, moving on our charts with their catalysts, and the playbook for the next one.
As you can see, we're really stacking the deck here…
Halloween flash sale
Yours to keep forever
Lifetime access to Slingshot is normally $497
Through Sunday night, one payment of
$97
No subscription fees. No annual renewals. No recurring charges. Slingshot Alerts and Find Better Charts beta access included.
This price ends Sunday, November 1 at 11:59 PM ET:
$97 once · lifetime · 14-day money-back guarantee
The Slingshot Edge Guarantee
Use Slingshot for 14 days. If it is not for you, ask through Support in your dashboard and you get every penny back. No questions asked.
Common questions
What platform does Slingshot work on?
Slingshot Live runs in your members area, and the indicator works on TradingView (the free plan is fine), on desktop, tablet and phone. Find Better Charts is included too.
Are there short signals?
No. Slingshot only buys: the pullback in a strong, steady stock and the turn back up.
Will I still get signals in a down market?
Yes. On the 30-minute chart there are pullbacks in up and down markets alike; over the last 90 days it called about 38.4 a week.
Can I just buy shares?
Yes. The calls are on the stock, with its target and safety net. The Options Guide shows you the options side if you prefer.
What about futures or forex?
Our calls cover the stocks and ETFs we scan. The TradingView indicator draws on any market TradingView has, but those aren't tested or called.
How long do trades last?
Until the target or the safety net, whichever comes first. The calls that reached the target took about 6 days (the median).
What are Slingshot Alerts?
Every Slingshot Buy as it's called, with the entry, target and safety net, then how it ended, in the Slingshot Alerts room in Telegram and Discord. You join from your members area.
What do I get on Find Better Charts?
Beta access to our own charting platform, any stock, from the daily down to the 5-minute chart, with Slingshot drawn on it. Open it from your members area.
I already own Slingshot. Do I need this?
No. It's already in your members area, and the alerts, Find Better Charts and the new bonuses are open to you too.
Is this a subscription?
No. One payment of $97 and it's yours for life.
What if it isn't for me?
You have 14 days for a full refund, no questions asked: just ask through Support in your dashboard.
After you order, don't close your browser. There's one more thing on the next page.
Ready to join? We're ready for you.
Somewhere this week a good stock will drop on a scary headline. Its candles will turn yellow. Then one will light up blue.
The only question is whether it's on your screen, with the target already on it.
$97 once · lifetime · 14-day money-back guarantee
P.S. The Halloween price, $97 for life instead of $497, with the alerts and Find Better Charts, ends Sunday, November 1 at 11:59 PM ET.
P.P.S. You're covered by the 14-day Slingshot Edge Guarantee. Watch the calls come in, and if it isn't for you, ask through Support in your dashboard.