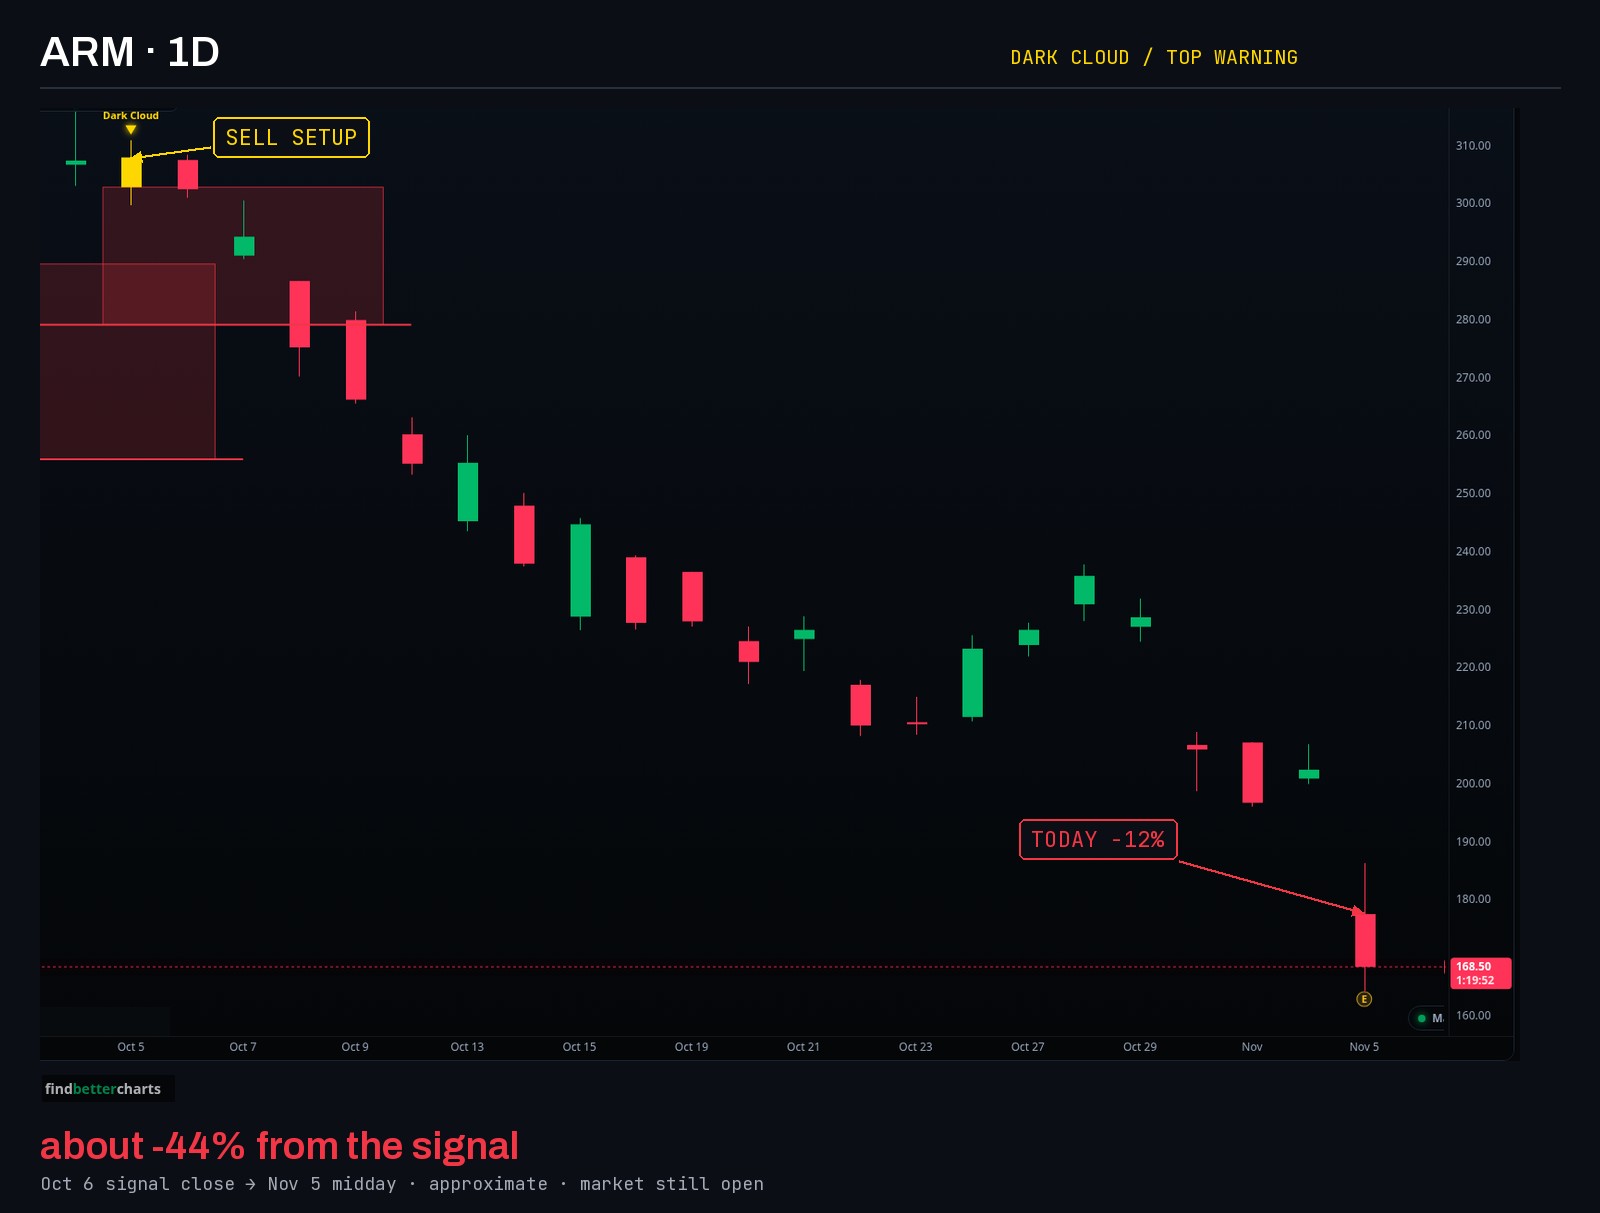
ARM · 1D
about −44%from the Oct 6 signal close
ARM threw the warning up near the top. Look where it is now.
Signal close about $303 → about $168.50 now.
Today: about −12%.
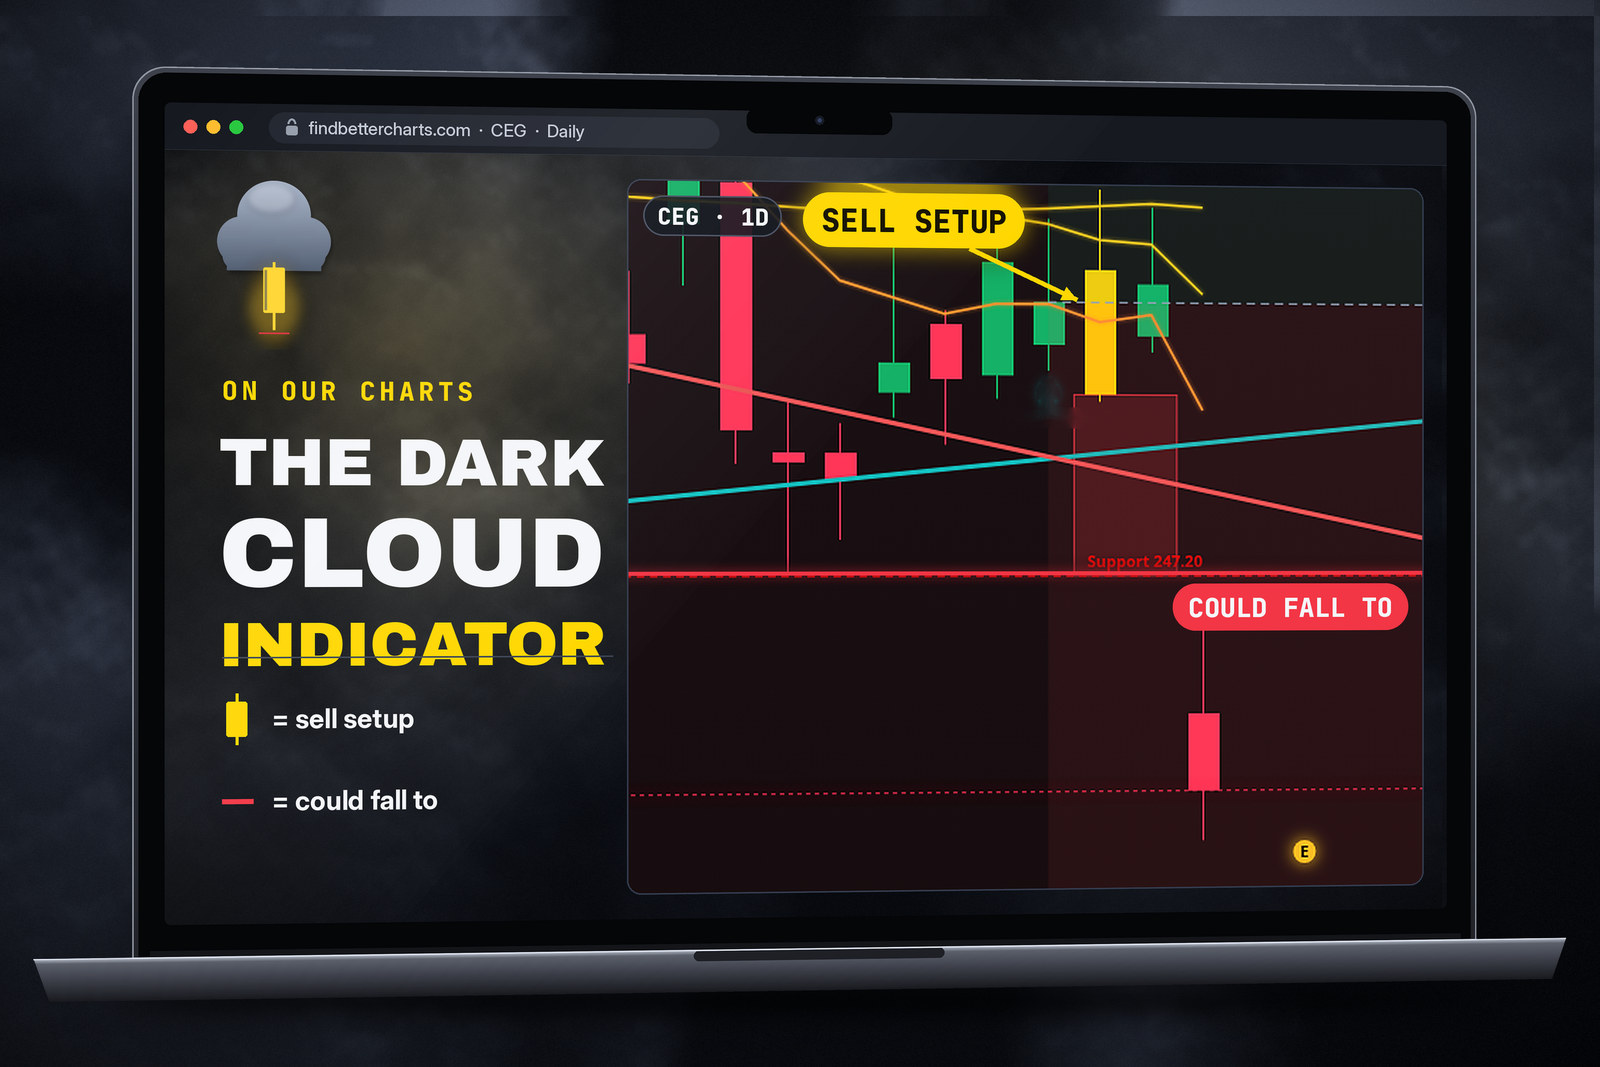
It's simple. Buyers gap it up. Sellers take it all back by the close. Dark Cloud paints that candle yellow and draws a red line where it could fall to. That's your sell setup.
Get Dark Cloud for $9 →$9 one time · lifetime · 14-day refund
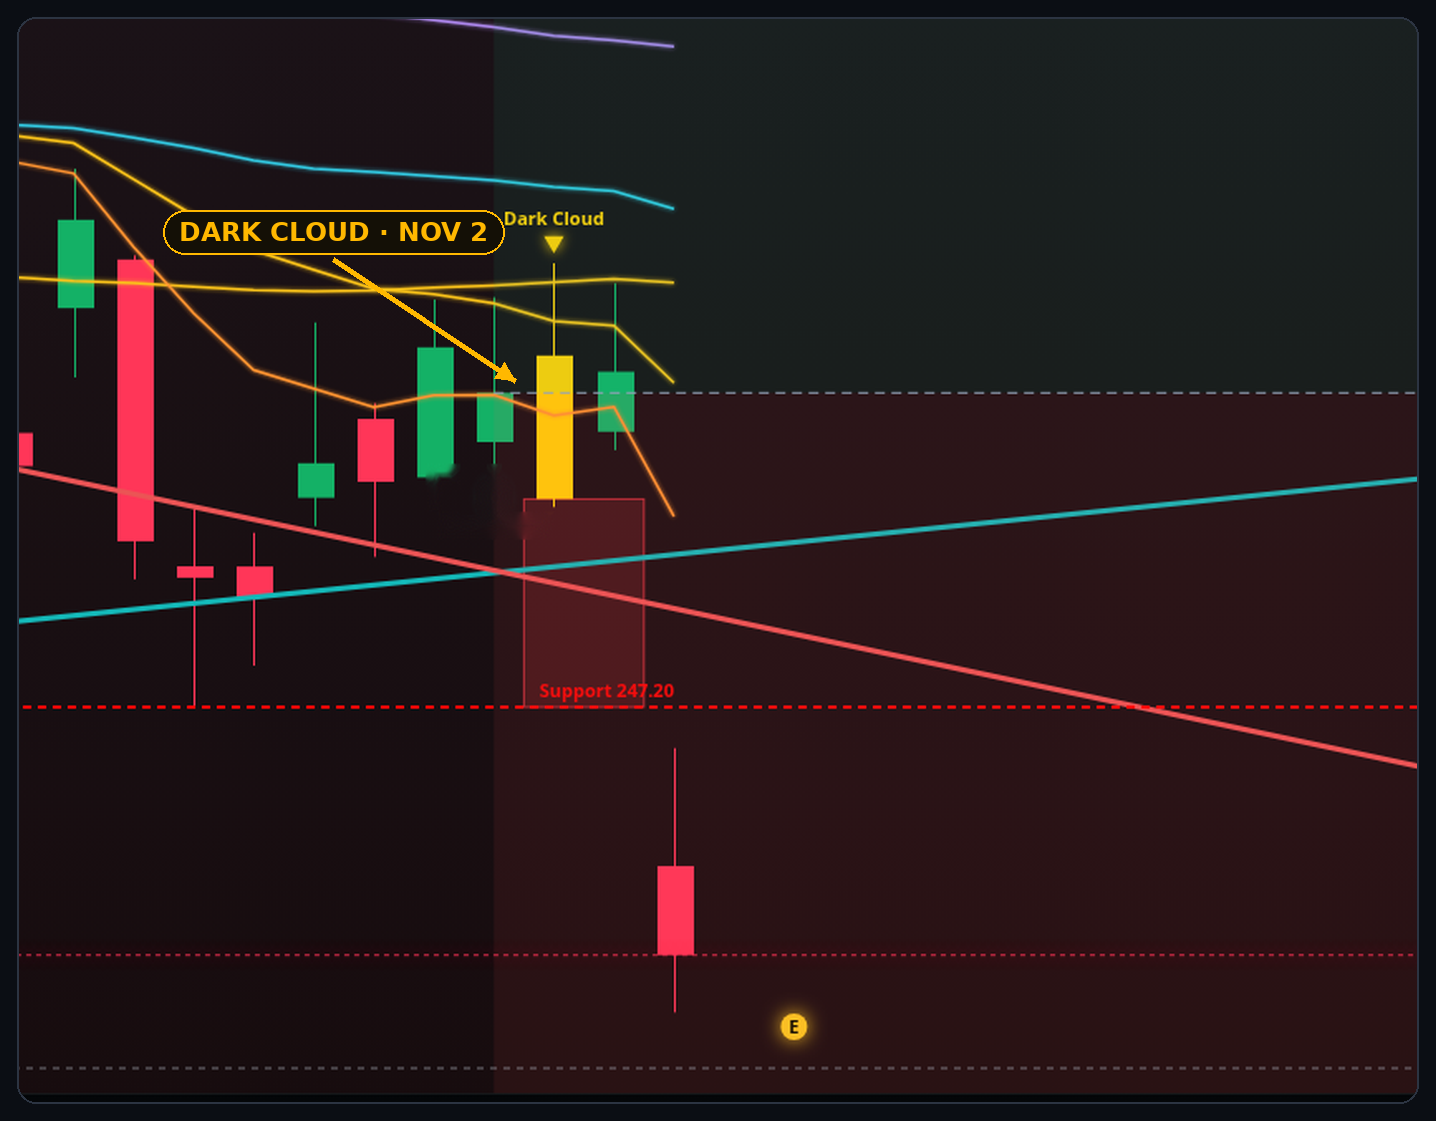
CEG, daily, from our own charts. Educational tool, not financial advice. Past results don't guarantee future results.
This sell‑off is exactly why you want to be watching a system like this. These are the ones that tap you on the shoulder at the top: hey, a big move down could be coming. It's the kind of system I always love to pull up and check out.
Days before today got ugly, Dark Cloud painted sell setups yellow. One candle. A red line under it. A top warning before the drop.
Here are 8 of them. Real charts. Ours.
Three more from our charts. The warning came first.
ARM threw the warning up near the top. Look where it is now.
Signal close about $303 → about $168.50 now.
Today: about −12%.
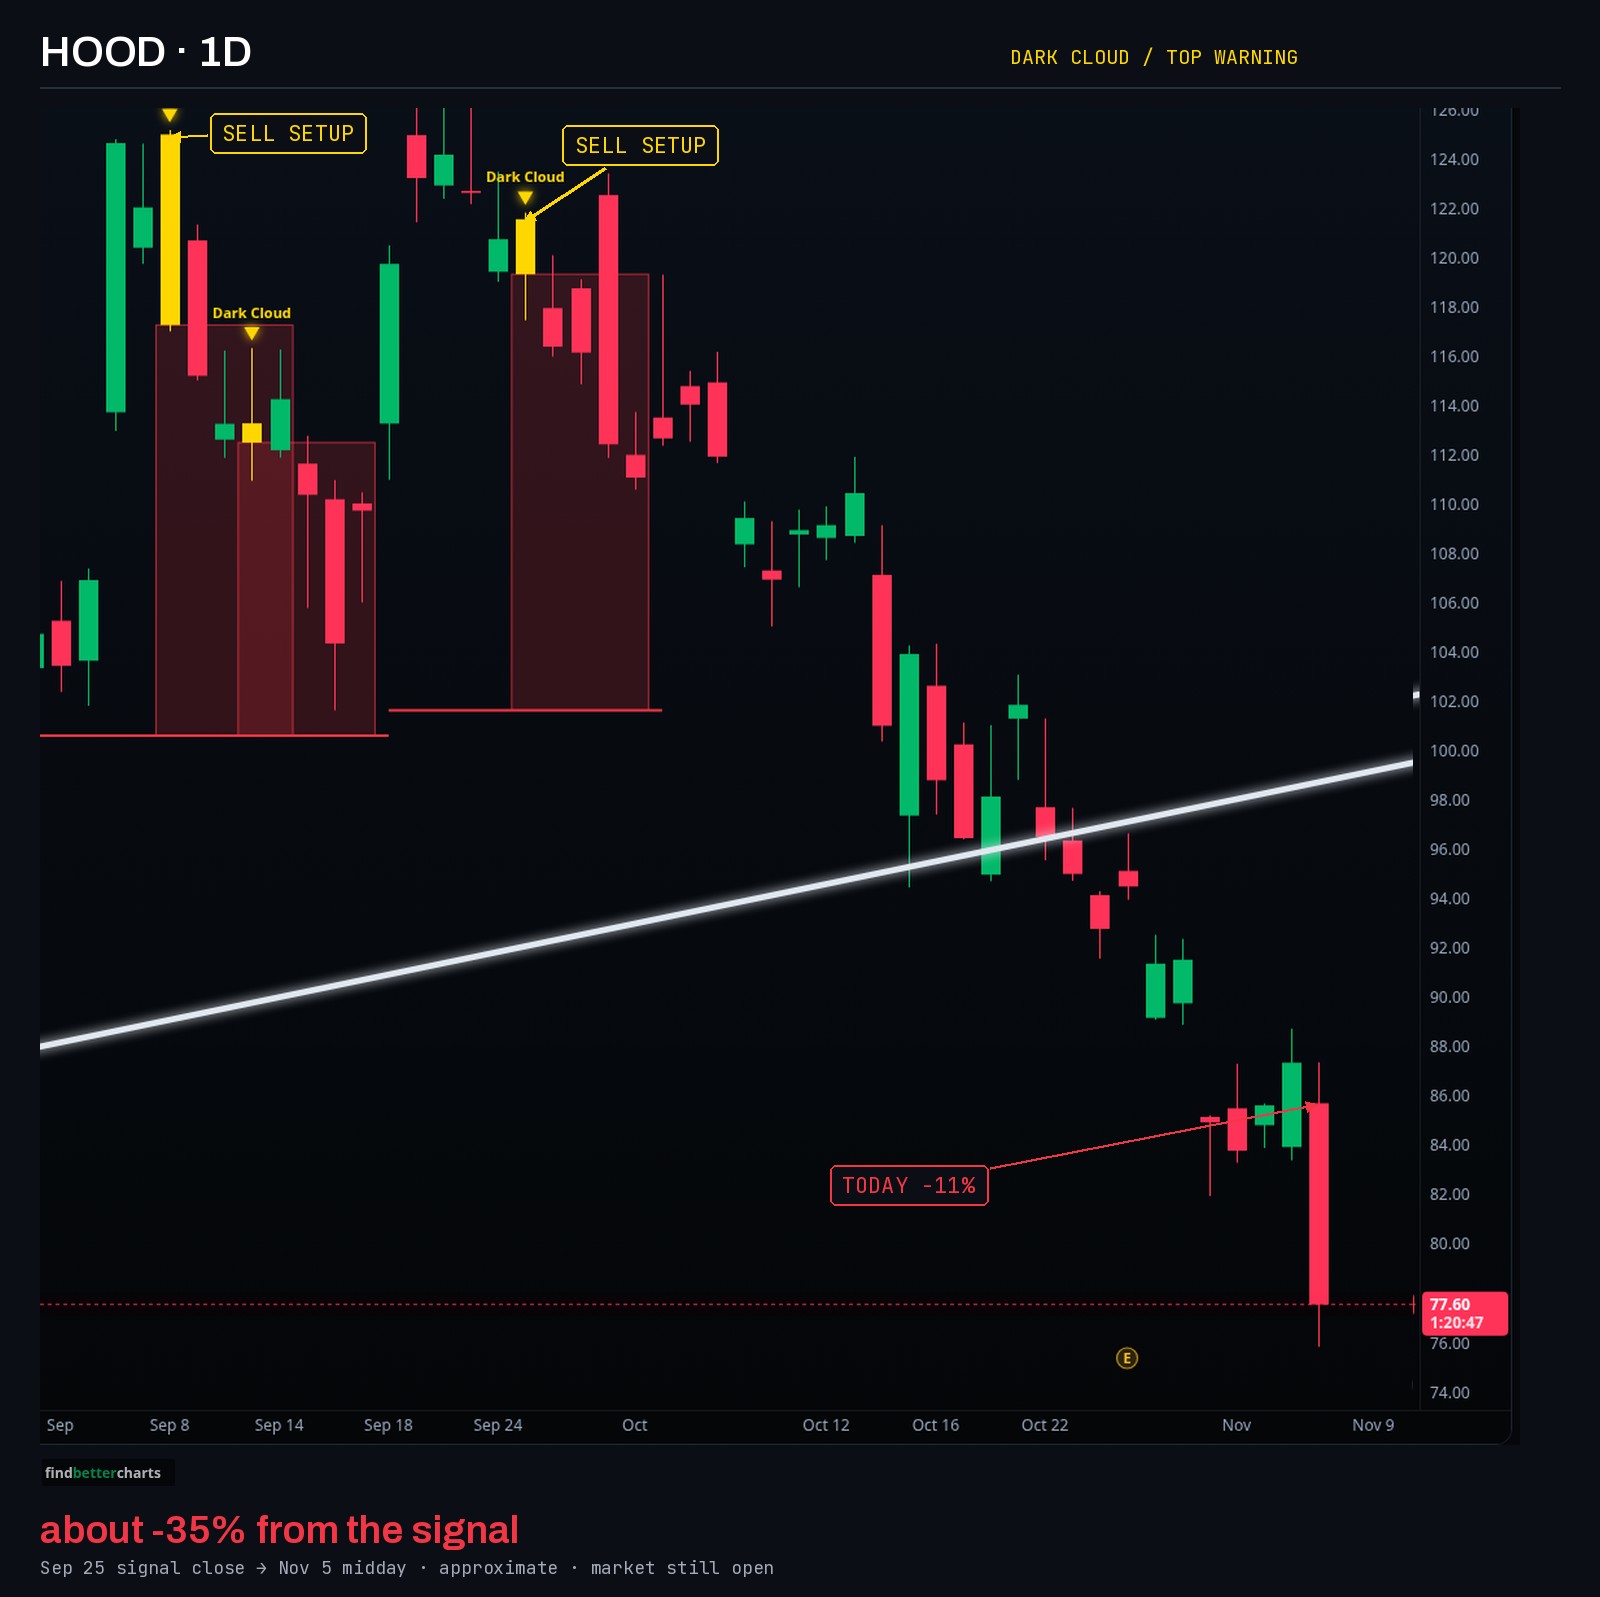
HOOD flashed it at the highs. Today just made the drop uglier.
Signal close about $120 → about $77.60 now.
Today: about −11%.
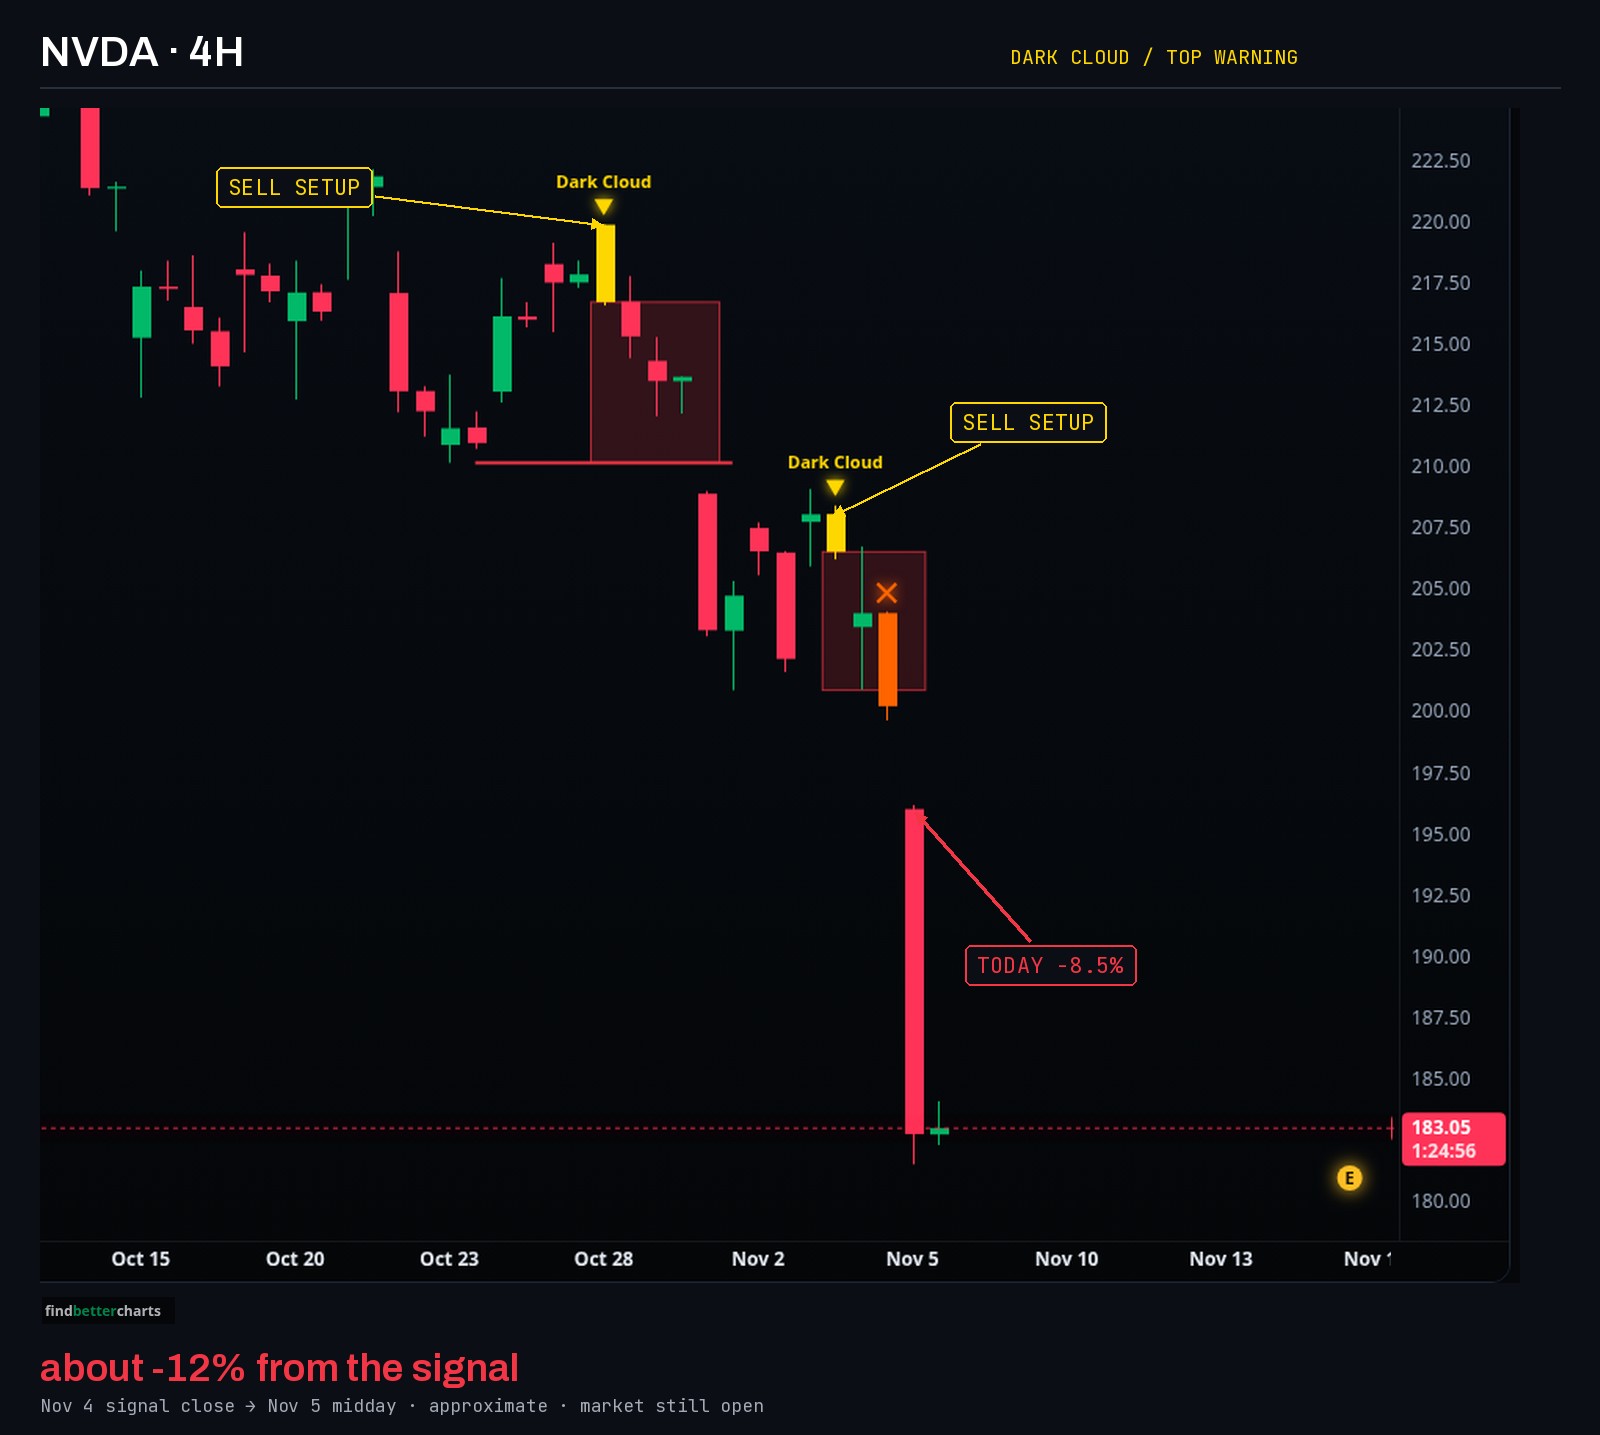
Even NVDA. A yellow candle before this leg down.
Signal close about $208 → about $183 now.
Today: about −8.5%.
Approximate, read from our charts, midday Nov 5, 2026. Not every Dark Cloud falls.
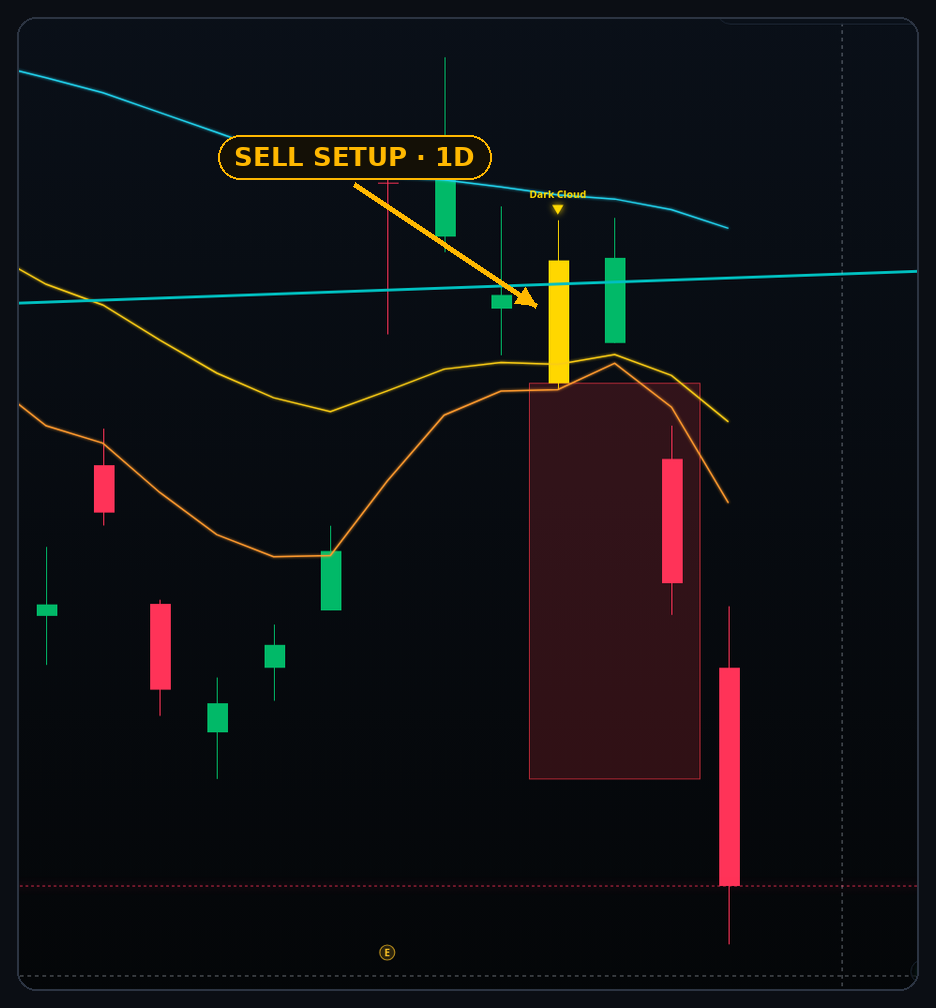
$177.23 at 12:26 PM ET, Nov 5
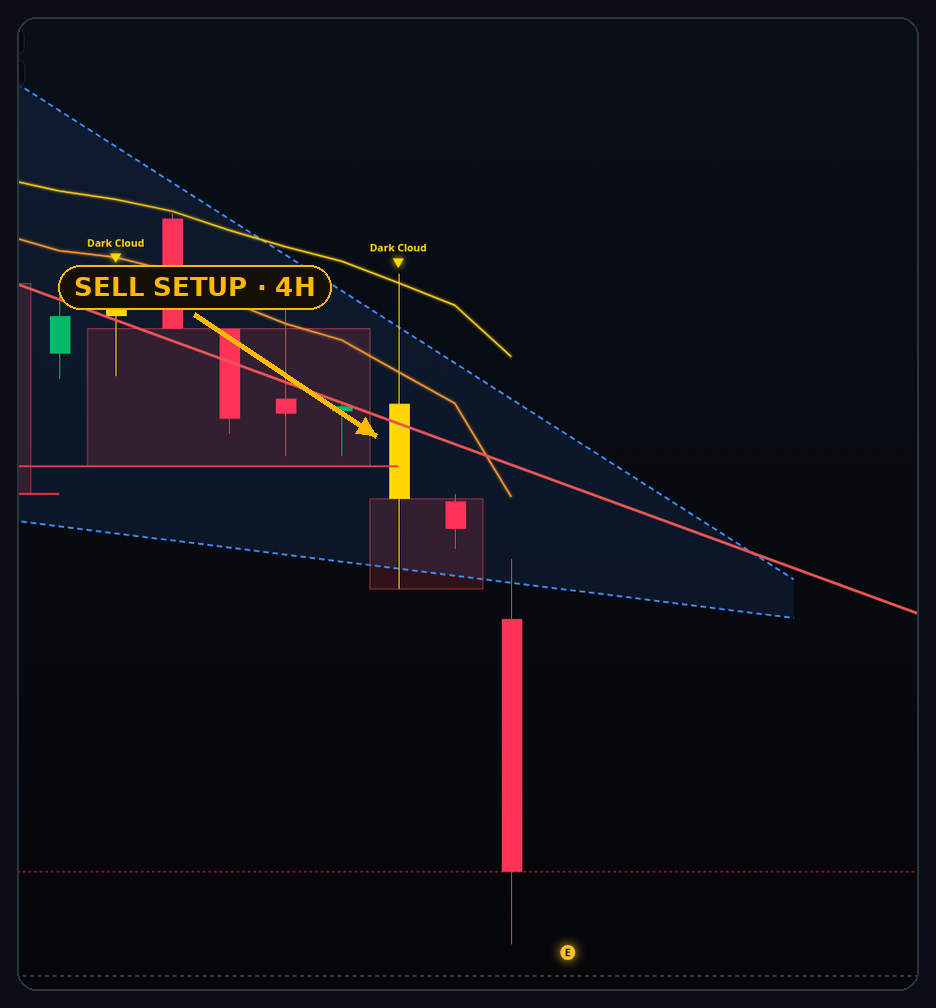
$4.45 at 12:25 PM ET, Nov 5
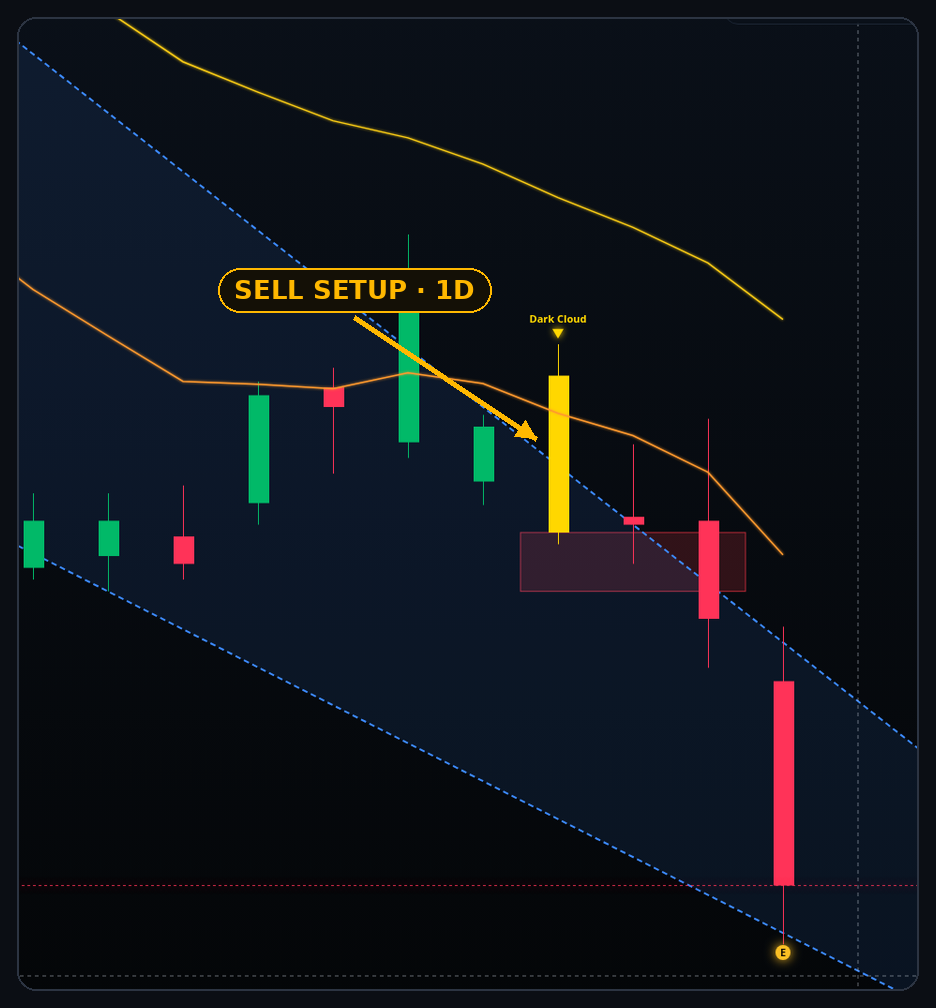
$4.45 at 12:20 PM ET, Nov 5
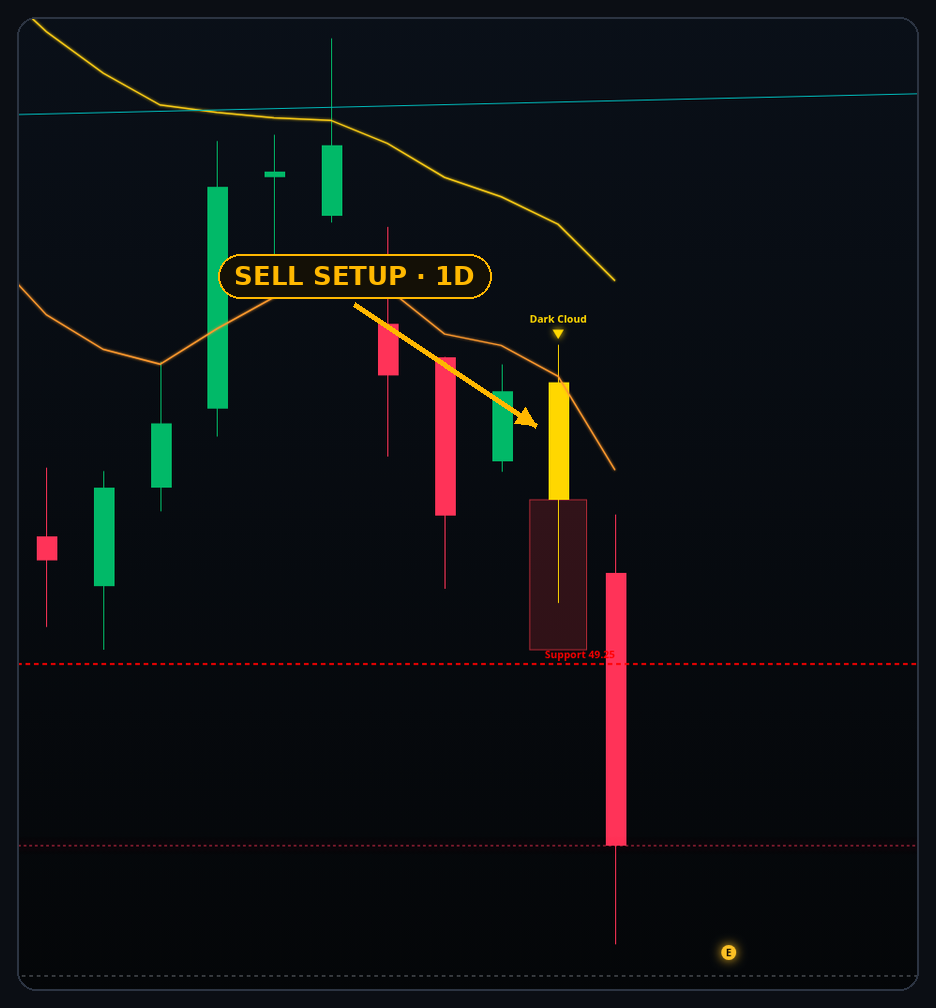
$45.80 at 12:27 PM ET, Nov 5
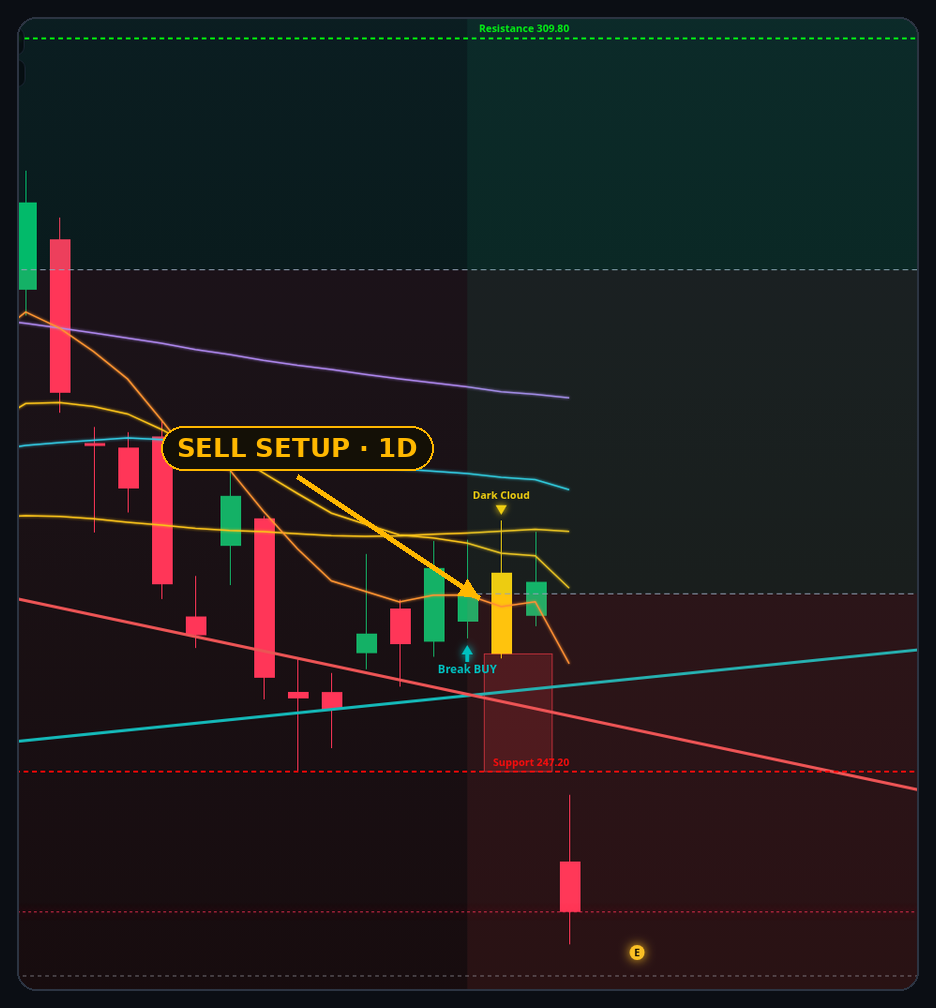
$235.22 at 12:18 PM ET, Nov 5
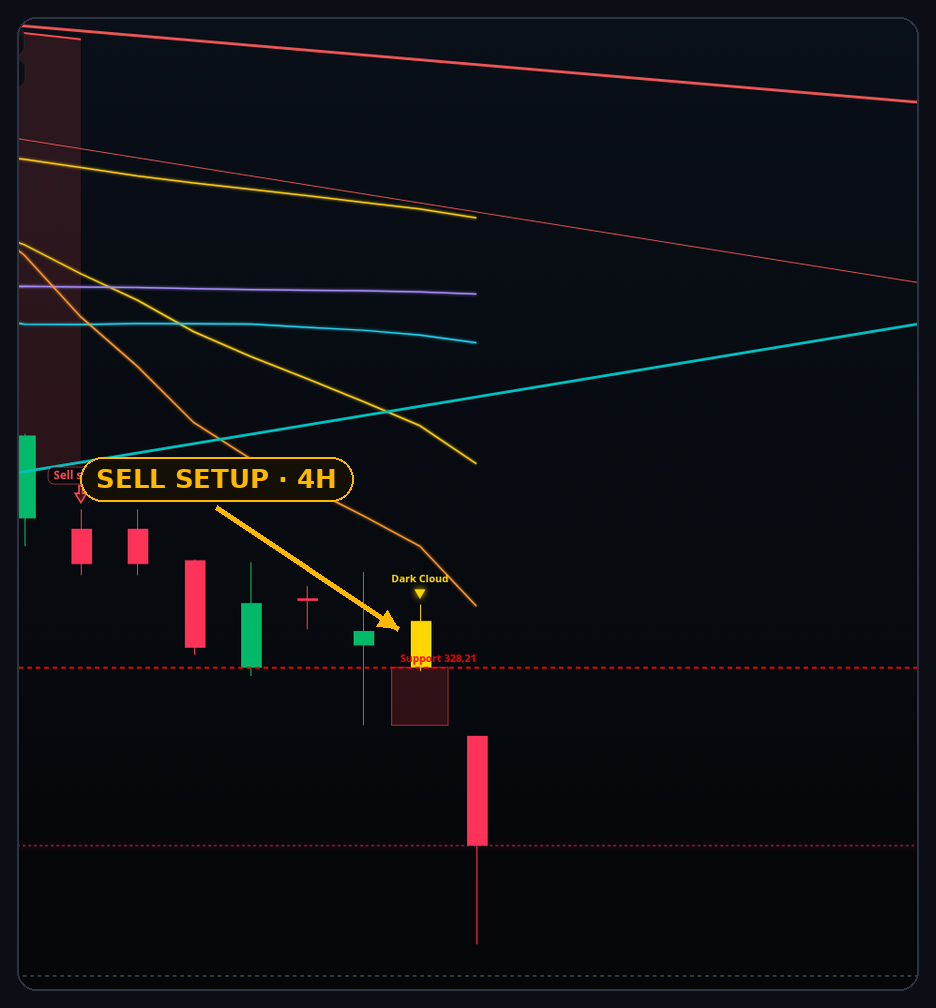
$309.02 at 12:22 PM ET, Nov 5
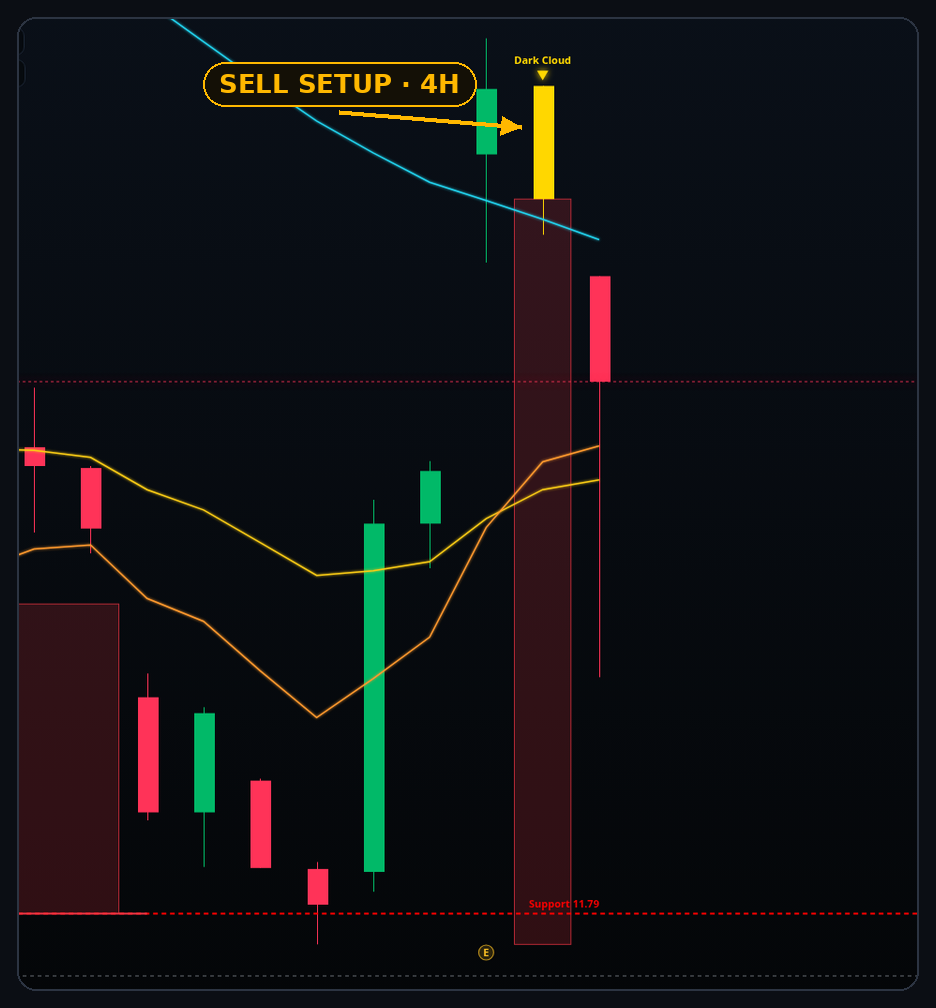
$14.47 at 12:24 PM ET, Nov 5
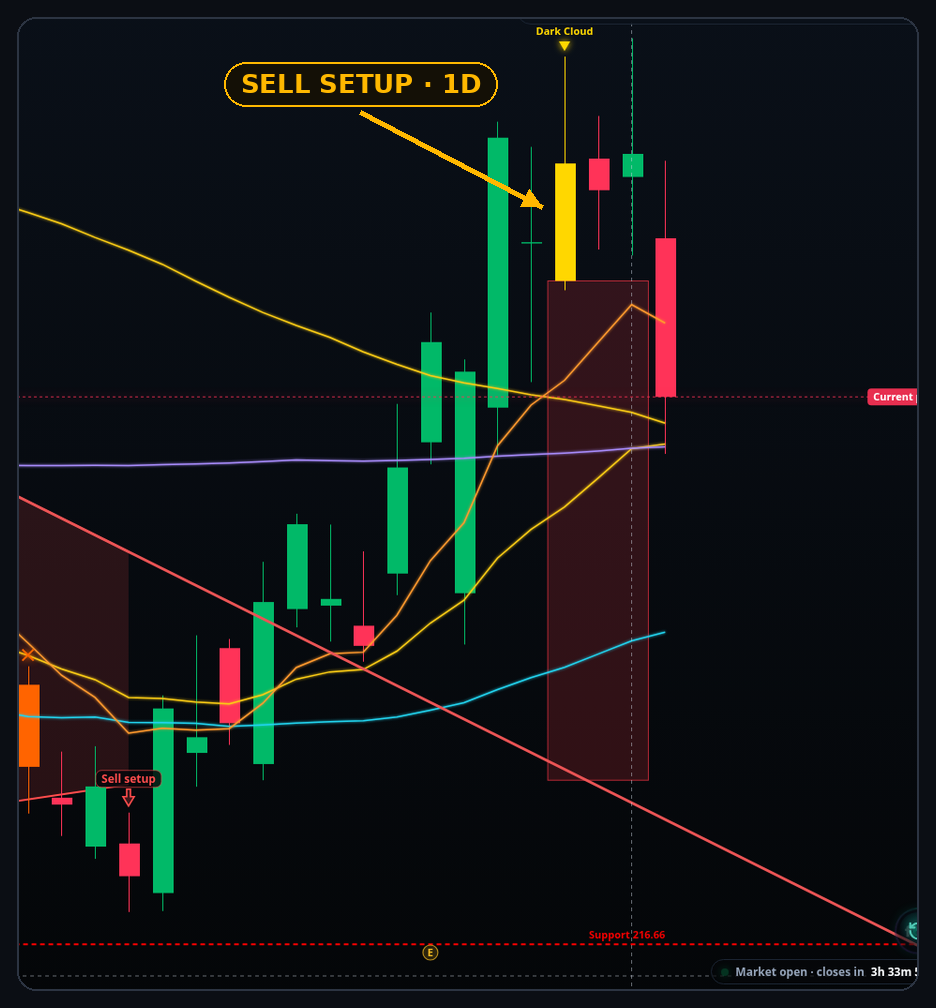
$250.15 at 12:26 PM ET, Nov 5
Approximate move from the sell setup candle's close to the Nov 5 midday price (market still open), read off Find Better Charts. A hand-picked set, not a track record. Not every sell setup falls. Past results don't guarantee future results.
So what's going on in that one candle? I call it
It's a very simple signal. And it's one of the most honest candles on the chart. Here's why.
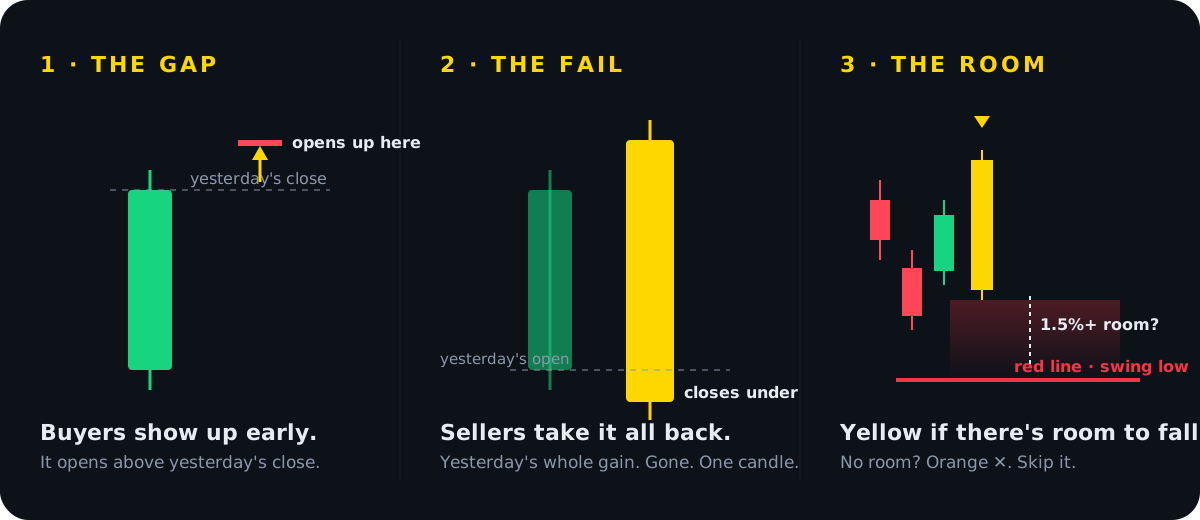
Yesterday was green. This morning it opens even higher, above yesterday's close. Buyers are chasing. Nobody wants to miss it.
Then sellers lean on it. All day. By the close it's under yesterday's open. Today's gap? Gone. Yesterday's whole gain? Gone too.
That's the bearish engulfing. The Dark Cloud.
Think about who's holding it. Everybody who bought that gap this morning is underwater. Everybody who bought yesterday's green candle is underwater too.
That's a lot of people looking for a way out. When they bail, that's more selling.
Buyers showed up. And they lost. In one session.
At a top, the buyers who are left are the late ones. The ones chasing. When their gap fails, there's nobody behind them to keep pushing.
At a key level, like an old high or a level it's stalled at before, sellers are already waiting. A gap right into that level, then a close under yesterday's open? That's the level winning.
Dark Cloud looks back 10 candles for the swing low. If it's at least 1.5% under the close, there's room to fall. The candle gets painted yellow and the red line goes at that low. That's the last place buyers really stepped in.
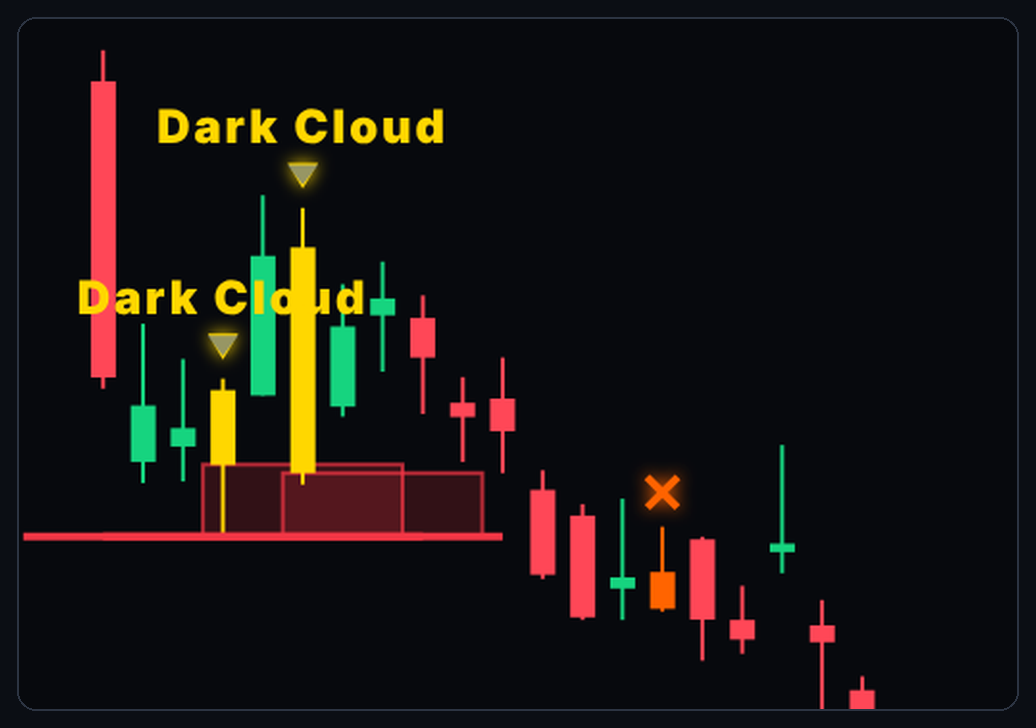
SMR in September: yellow ones with a red line, and an orange ✕ to skip.
Four tools you use every day. Six bonuses that make the sell setups easier to act on.
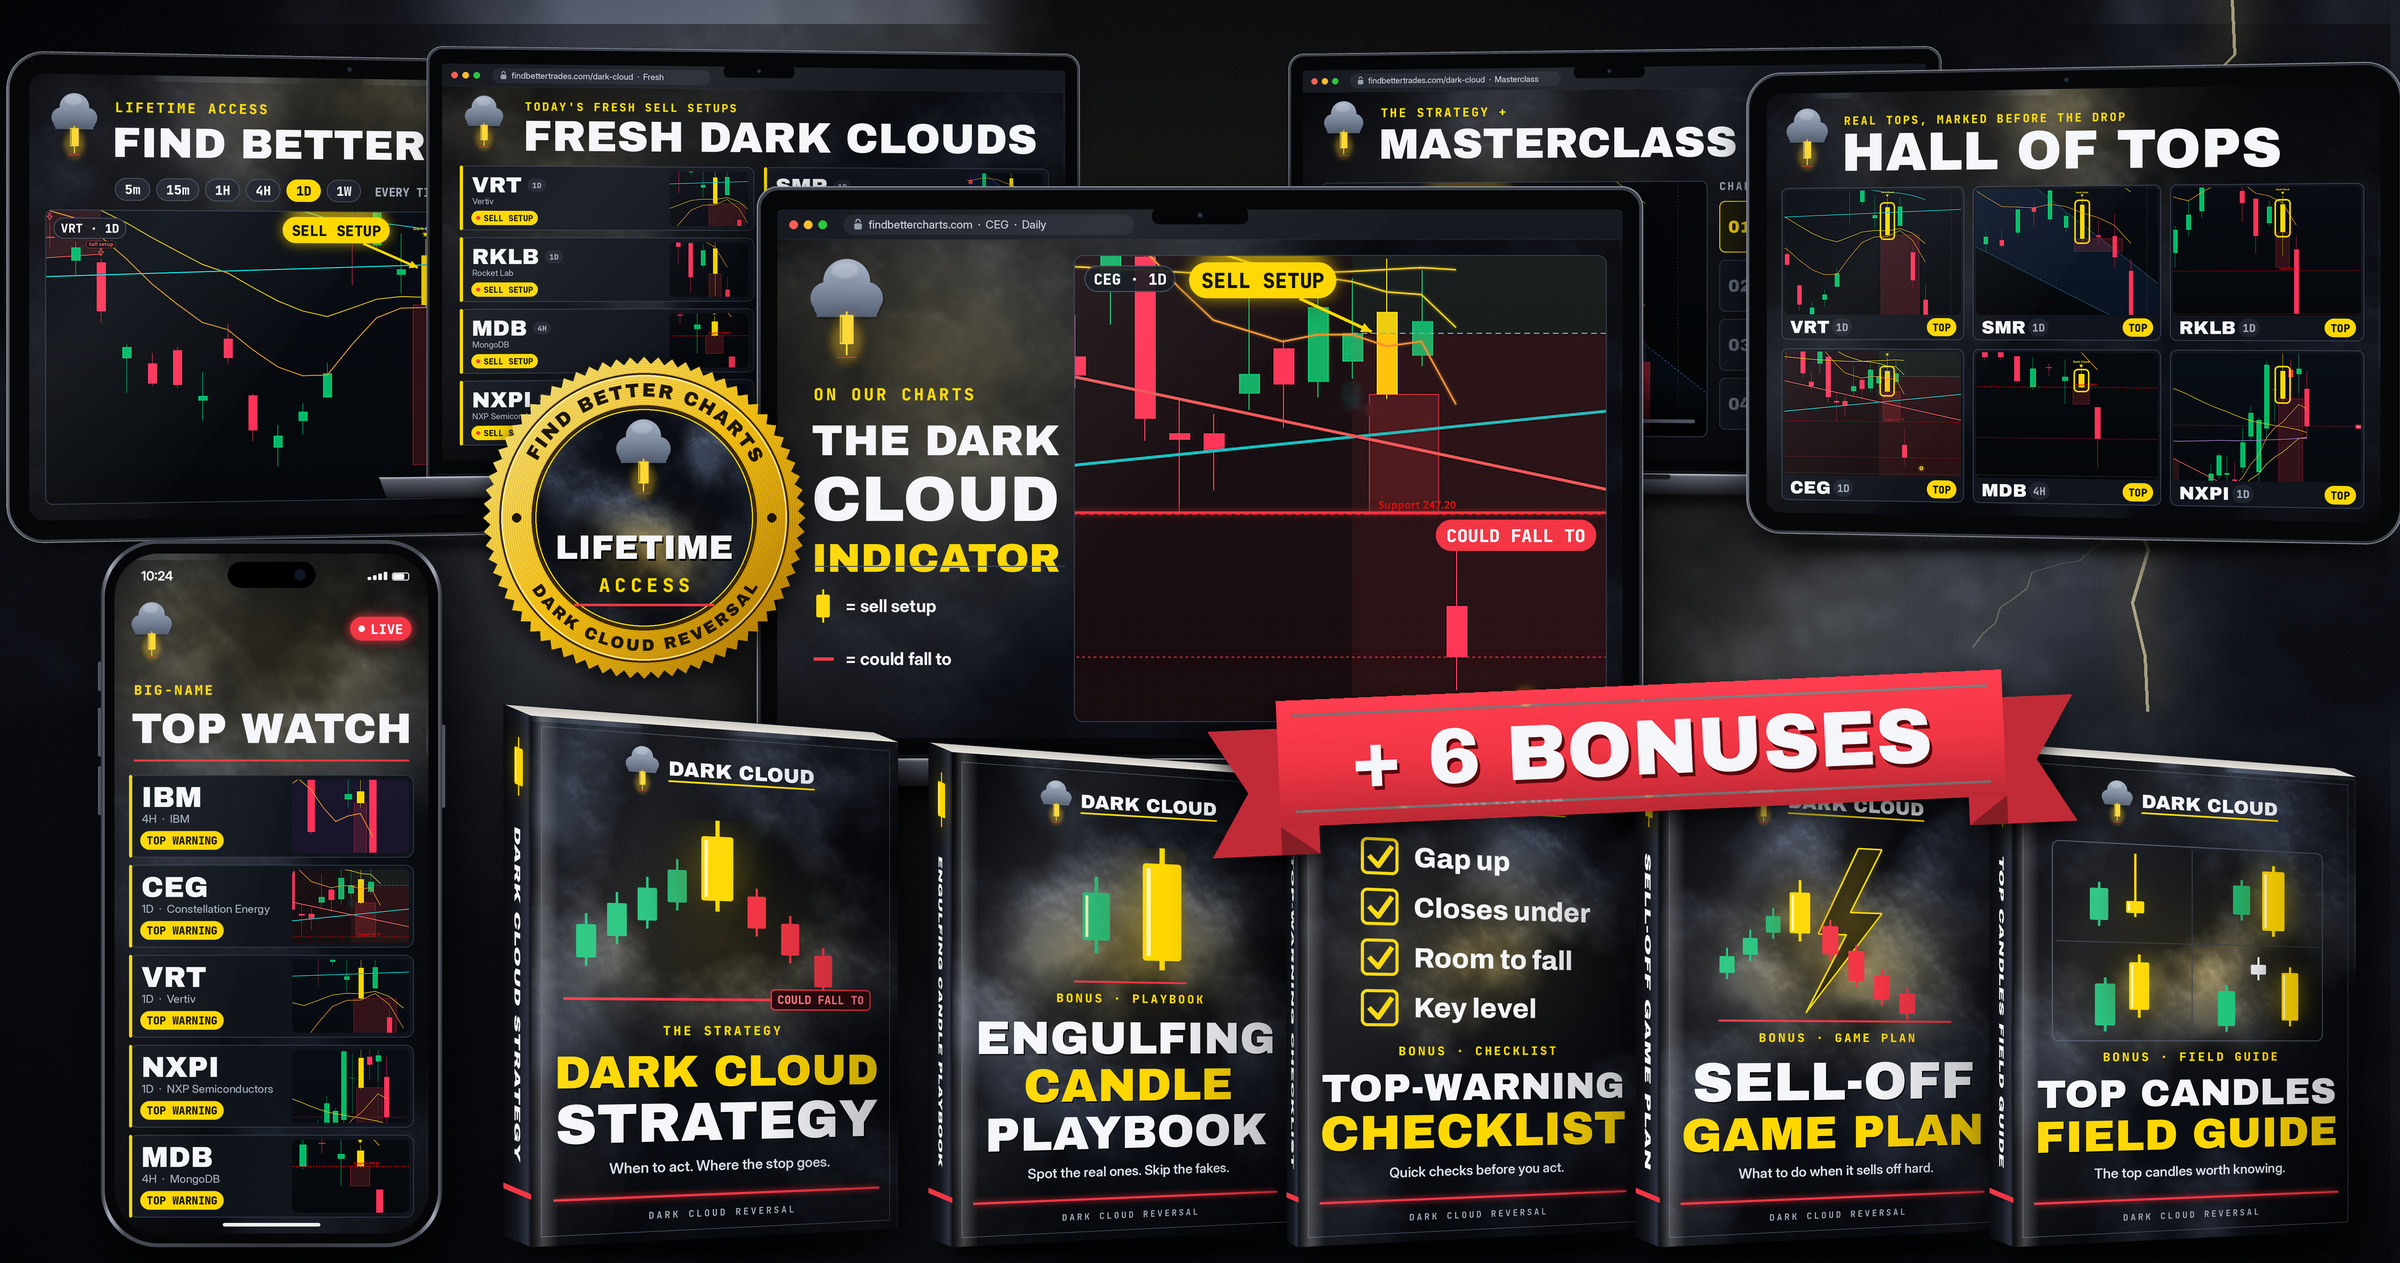
Every sell setup painted yellow with its red line, on our charts.
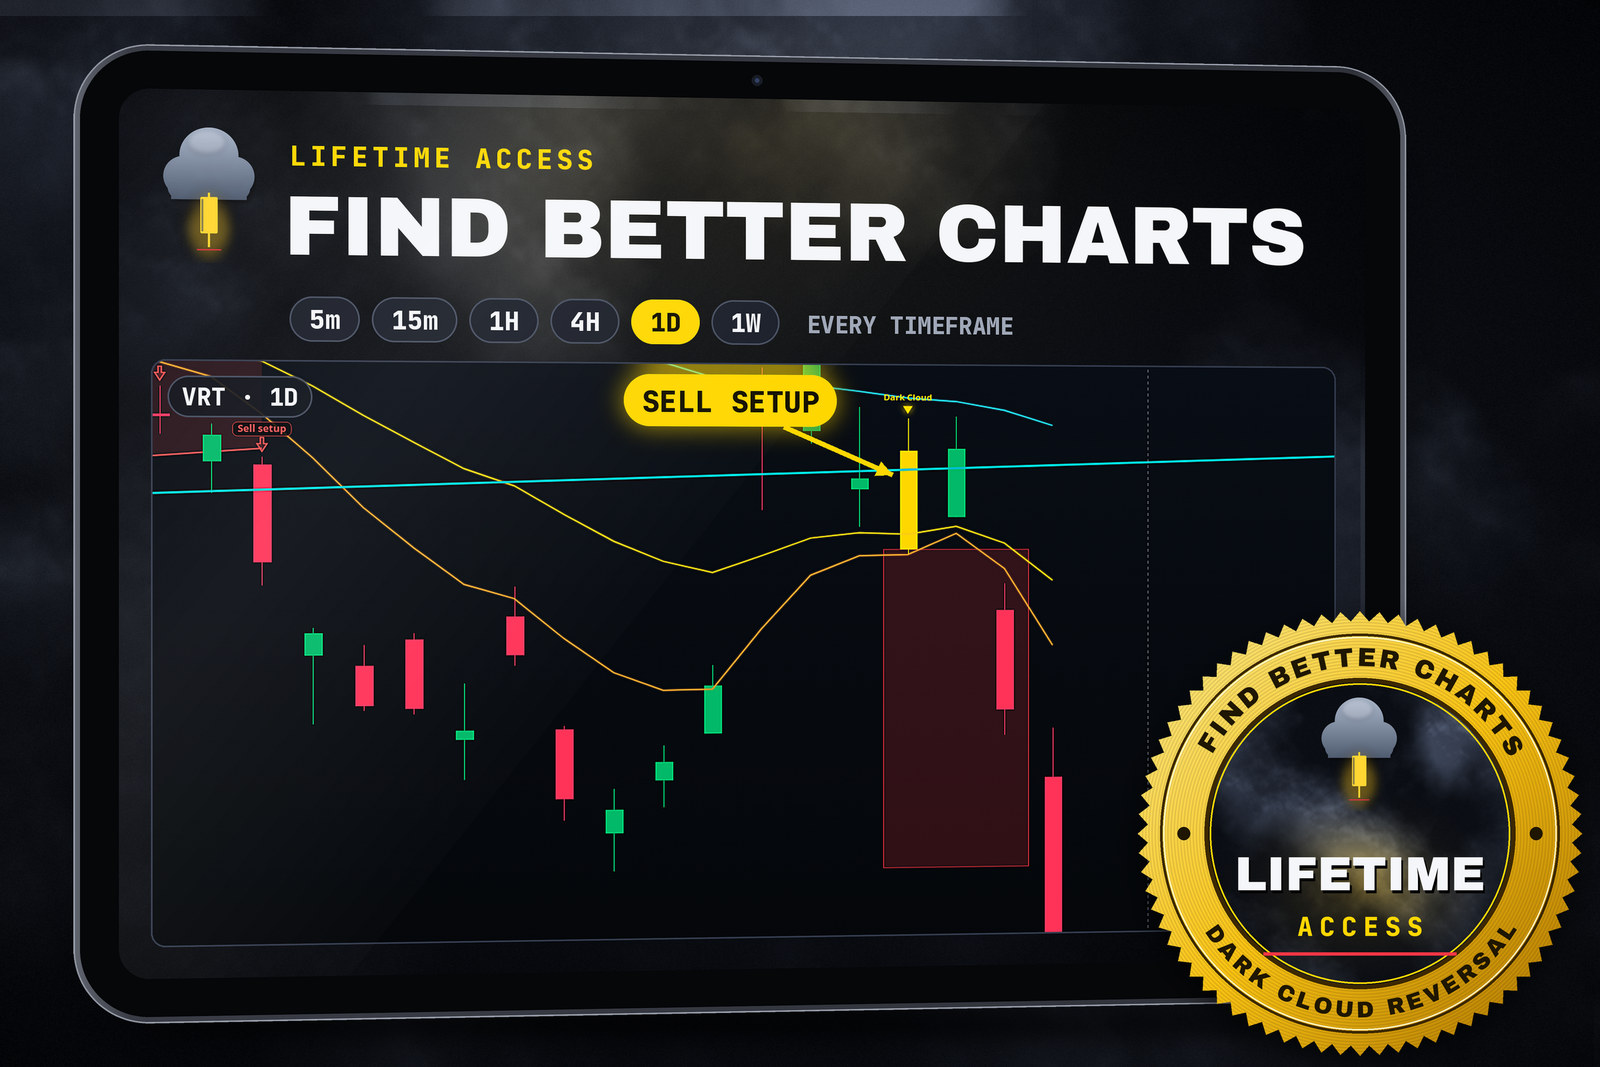
Lifetime access. Every timeframe, 5-minute charts included.
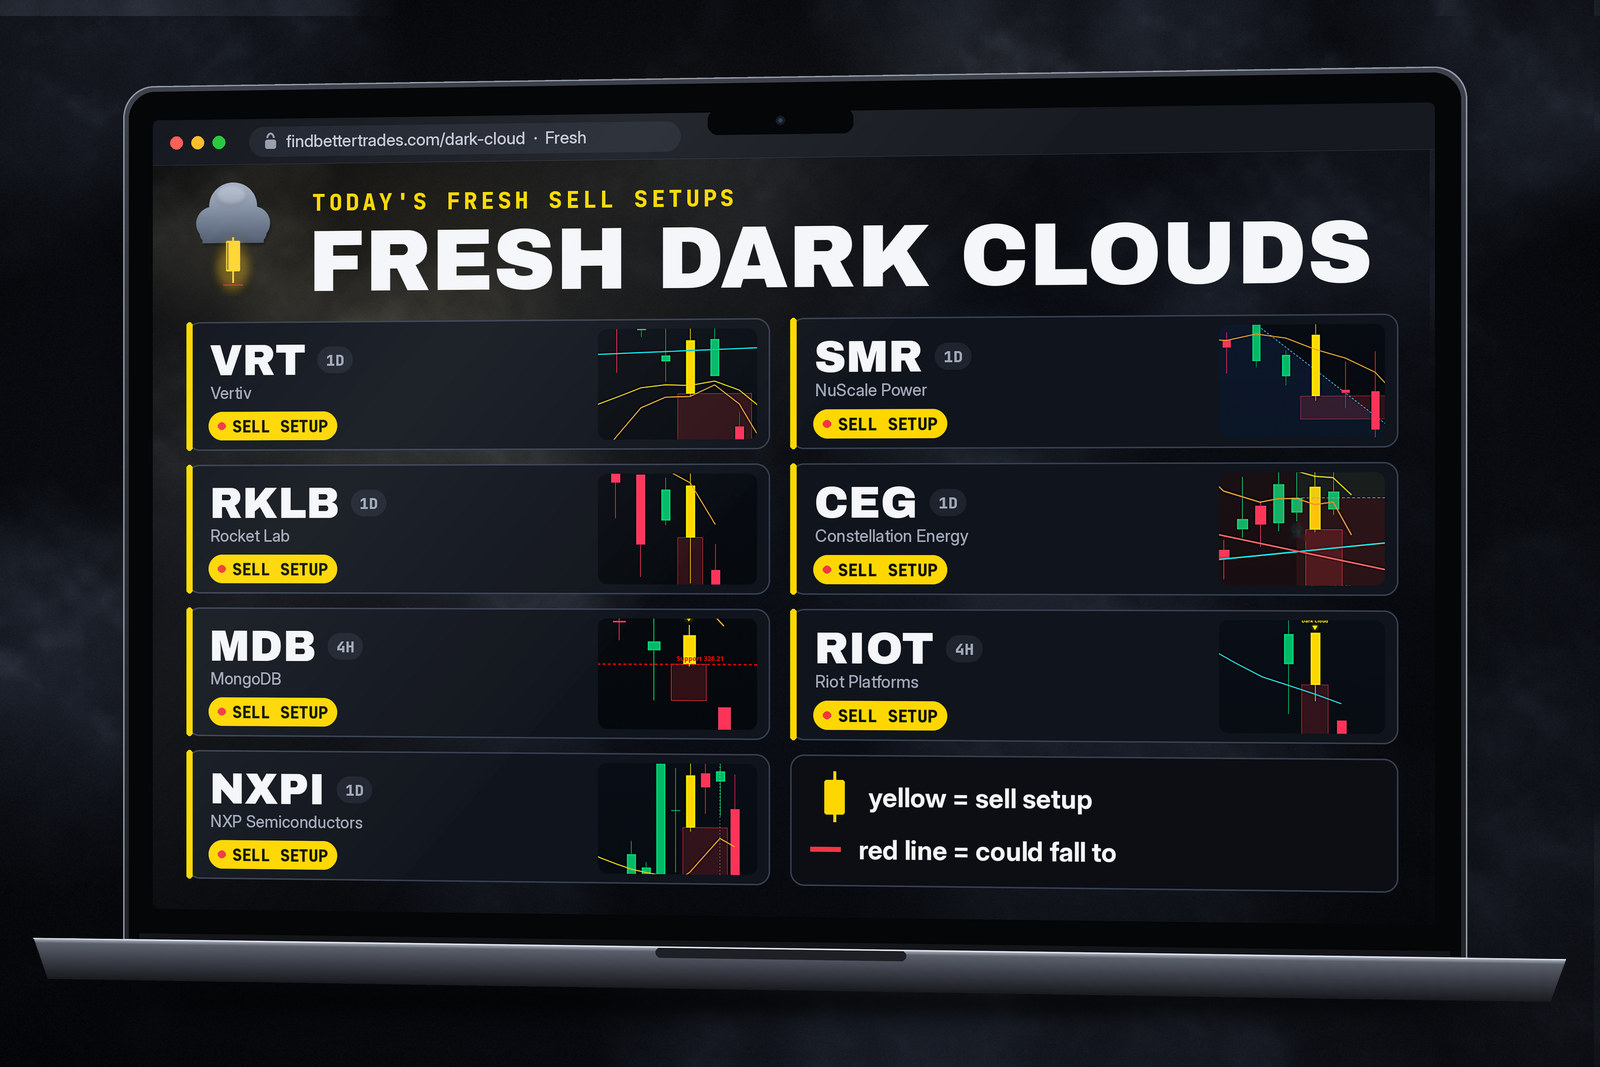
Today's fresh setups, listed so you can scan them fast.
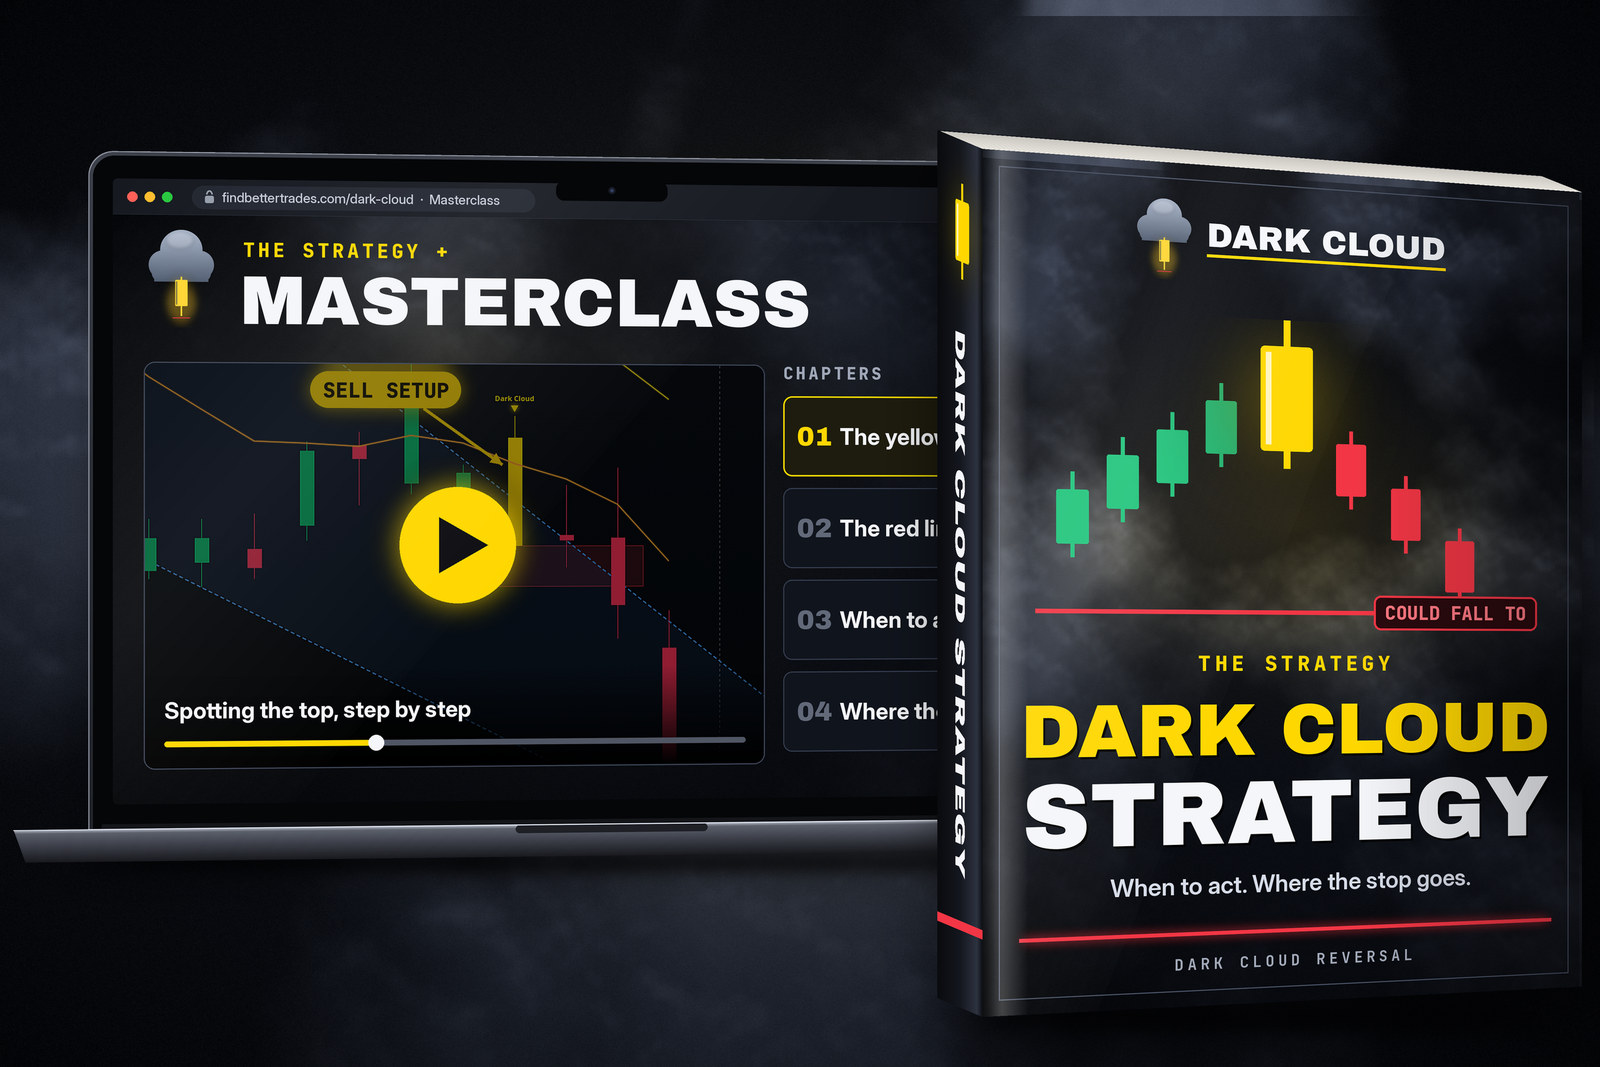
When to act, where the stop goes, and the walkthrough on video.
Same $9. No upsell on this page.
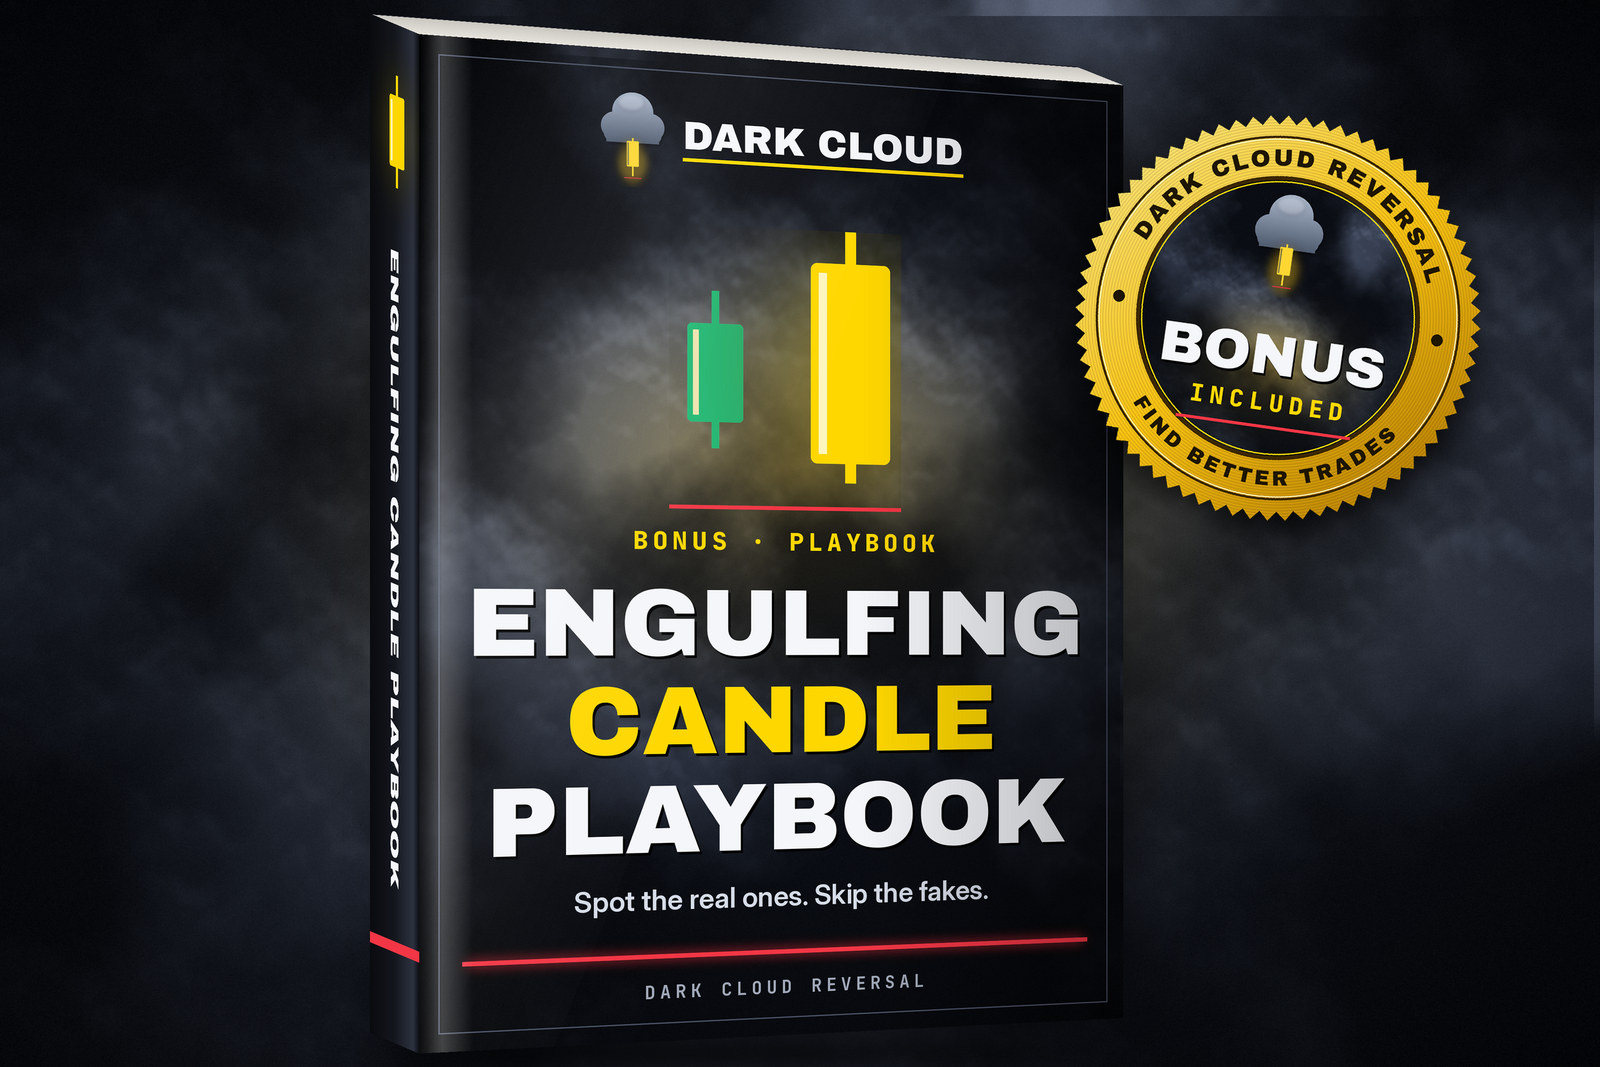
How to spot a real engulfing — and skip the fake ones.
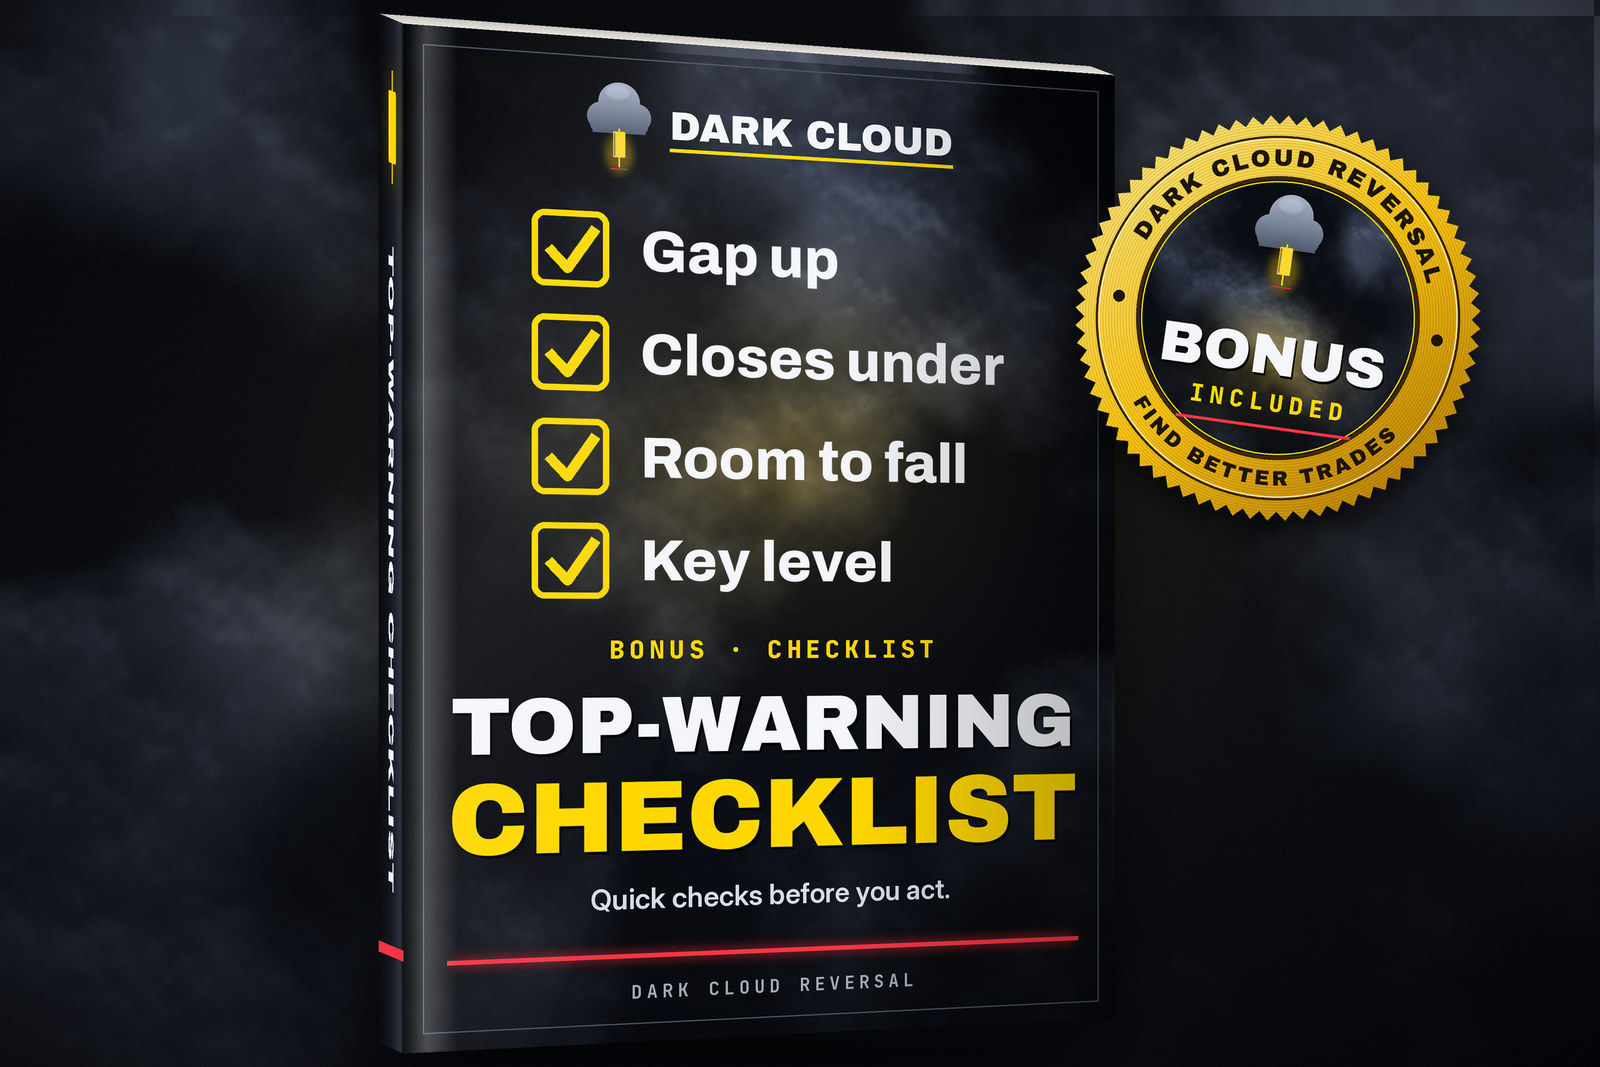
Quick checks before you treat a yellow candle as a top warning.
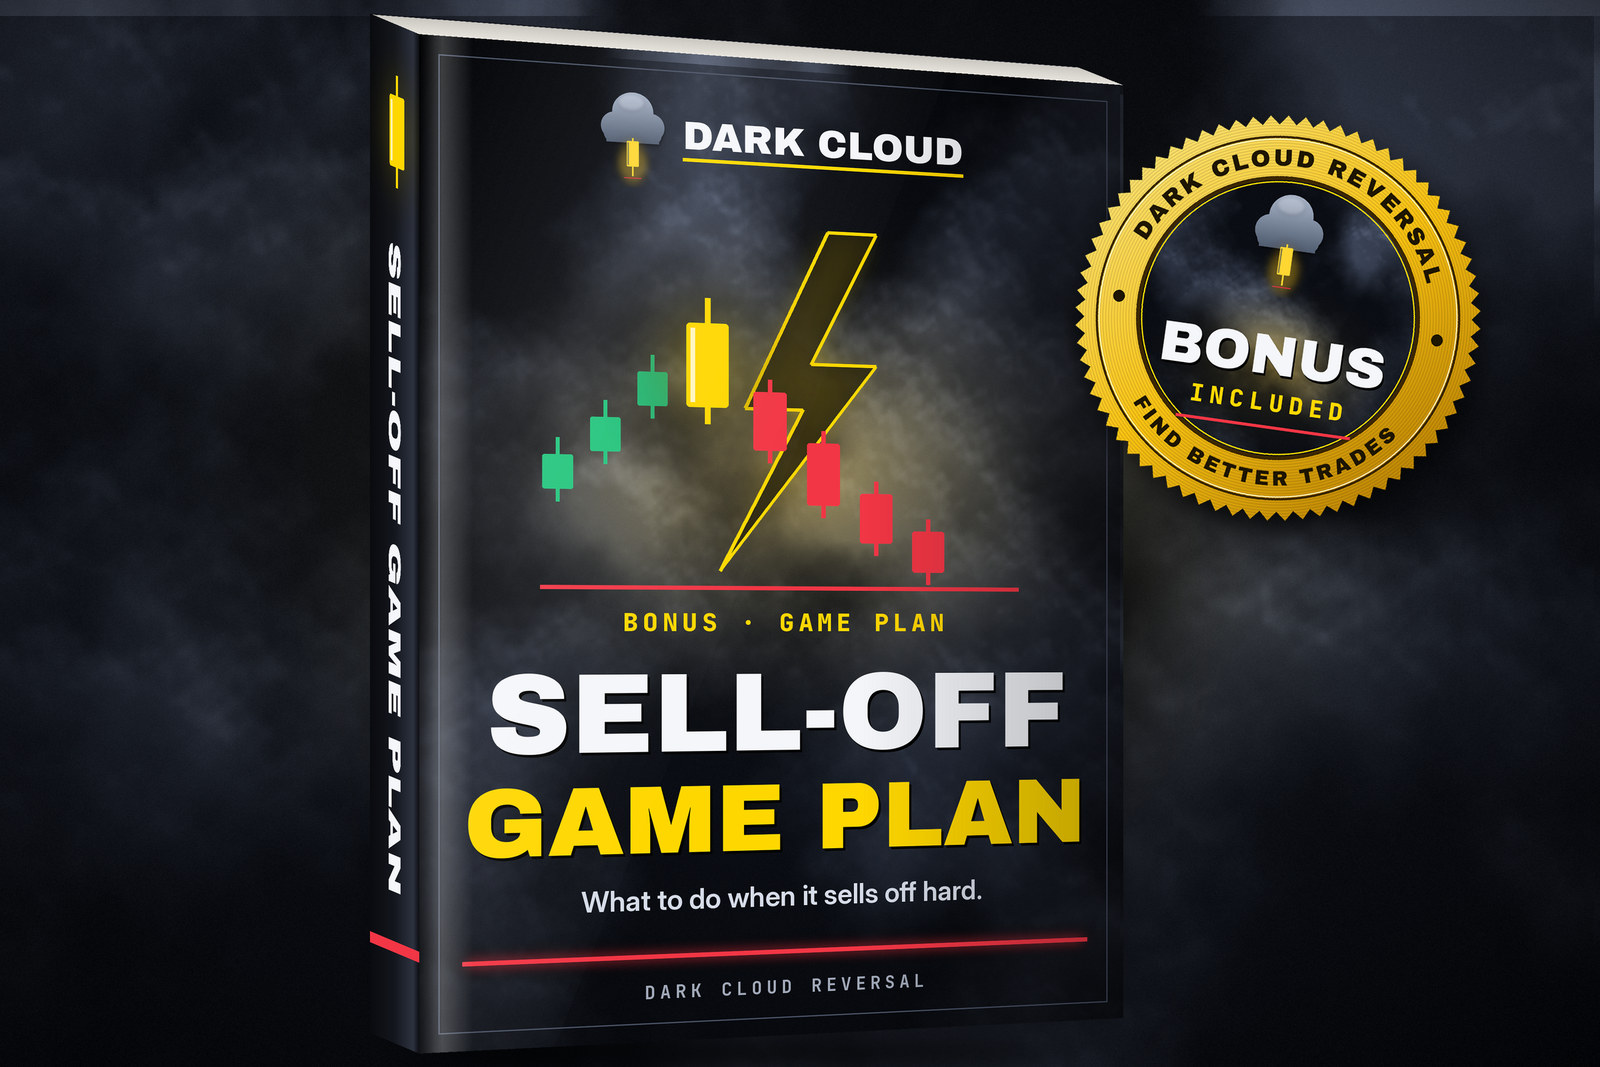
What to do when the market is selling off hard.
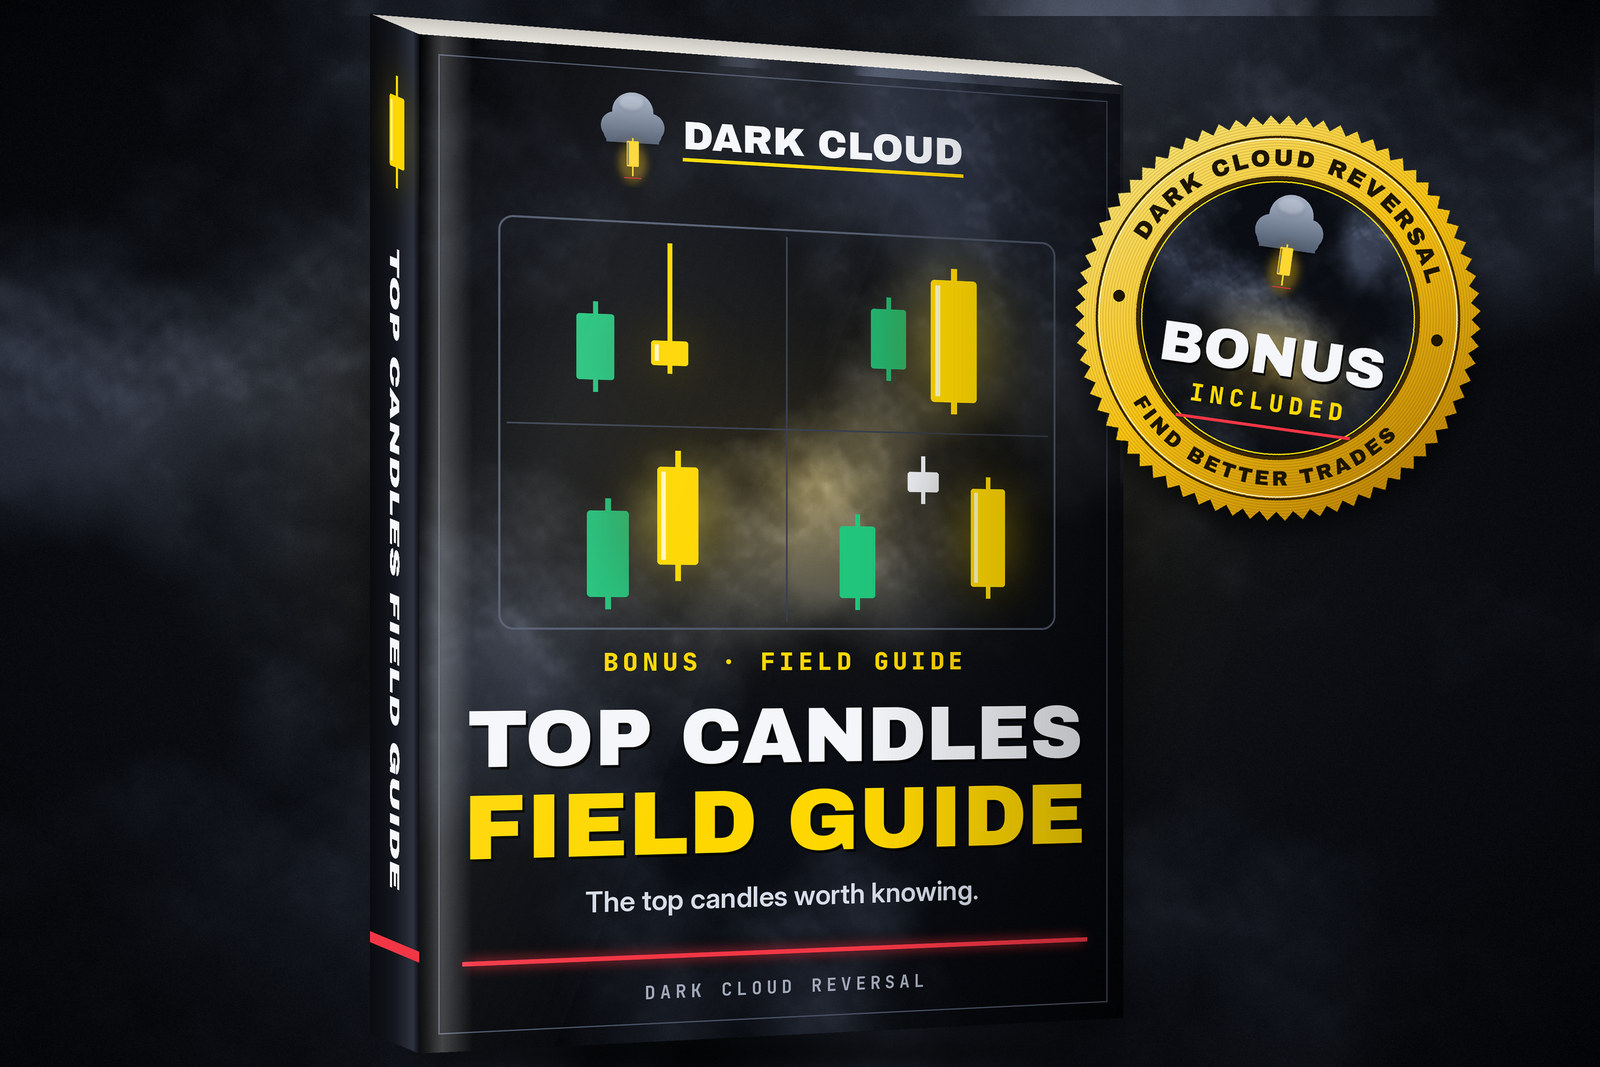
The top candles worth knowing, in one place.
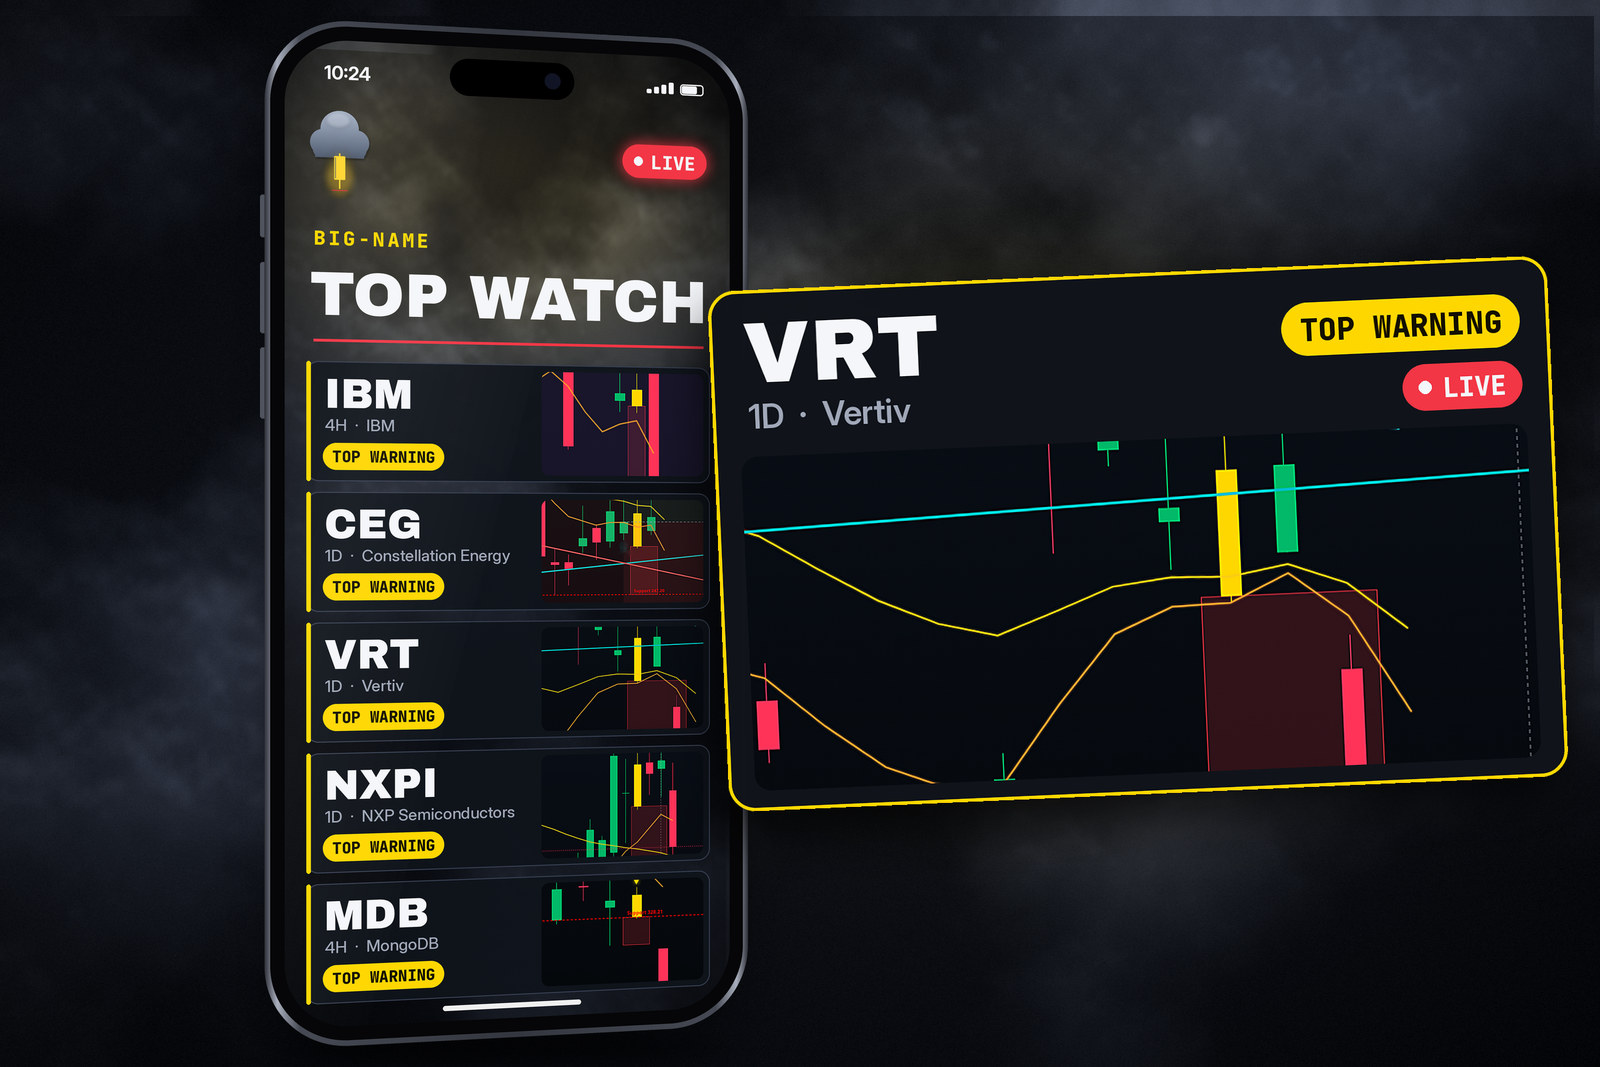
Live watch on big names printing tops.
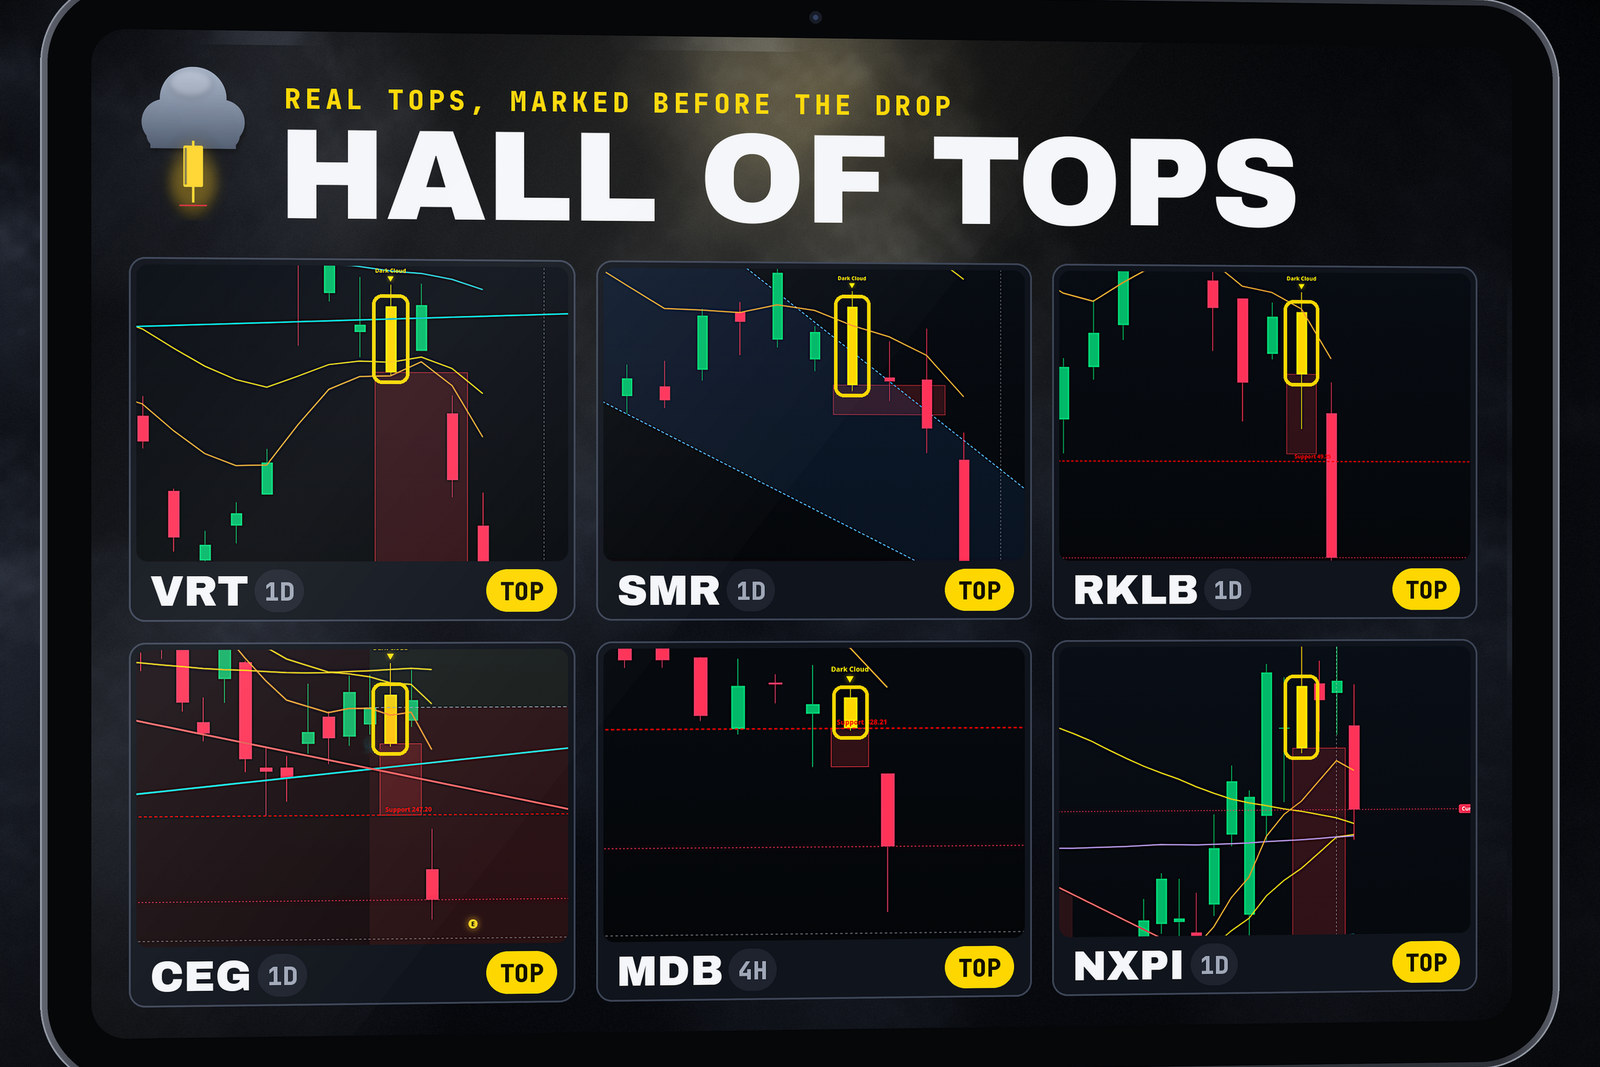
Real tops Dark Cloud marked before the drop.
One payment. Yours for life.
Use it for 14 days. Not for you? Ask through Support in your dashboard and you get every penny back.
A sell-side system that marks the top. It finds a bearish engulfing candle at a top or a key level, paints it yellow, and draws a red line where it could fall to.
No. Some barely move. It's a warning, not a promise. What you do with it is your call.
Yellow means there's room to fall, a swing low 1.5% or more under the close. Orange with an ✕ means there isn't. Skip those.
No. $9 once, lifetime. Every timeframe on Find Better Charts, 5-minute included.
No. It's an educational tool. You make your own calls.
Buyers will gap something up. Sellers will take it all back. You can find out a week later. Or that afternoon.
Get Dark Cloud for $9 →$9 one time · lifetime · 14-day refund
— Ben