Indicator Bonanza · drop 4
Price has gravity. Now you can see it.
Price gets pulled into the zone where the volume sits. It's held there. And every so often, it escapes. Gravity Zone draws that zone on every chart for you and shows you which of three things is happening. One of them is the alert we send you.
It escapes the zone on real volume. That's the alert we send you.
PANW · May 8 · +32% 2 · on your chartGravity BounceIt dips to the edge and gravity pulls it back. You see it on your chart; we don't send it as an alert.
SLV · Mar 3 · +8.6% back to gravity 3 · the warningGravity BreakdownIt falls out the bottom. That's your warning: get out, or stay away.
COIN · Jan 21 · -38.6% after itReal charts from earlier this year, run back through Gravity Zone. Only the break is sent as an alert. Tap one to see its story.
We do the charting. You get the best one.
Gravity Zone draws every setup on every chart: the breaks on the daily, 4-hour and 1-hour, the bounces back into the zone, the breakdowns out the bottom. On all 250 or so stocks and ETFs we scan, every day, it redraws each zone on every new candle and reads the last 200 candles' volume to do it.
Give each of those charts just one minute and that's 12½ hours of charting. You don't do any of it.
Then it hands you only the one that tested best: the daily Gravity Break, confirmed on real volume. Everything else stays on your chart to read.
The Gravity Break: Palo Alto Networks, May 2026
Gravity held it for months. Sometimes price pushes up out of its zone and falls right back in; that's the chop that eats most traders. It's Gravity Zone's job to sort that out for you: it waits for the close out, a higher close to confirm it, and real volume behind it.
That's the whole plan on one card, the moment it fired. Nothing to work out, nothing that moves while you're in it: half off at the conservative target, a quarter at the moderate, the rest to the aggressive.
One of the best calls of the year, not an average one. Plenty of calls hit the stop, and the record inside keeps every one.
The Gravity Bounce: silver (SLV), March 2026
Inside the zone, price that reaches the edge often gets pulled back toward the middle. Gravity Zone draws that on your chart, so you can see what gravity is doing.
The Gravity Breakdown: Coinbase, January 2026
When price falls out the bottom of its zone, gravity has let go, and there's nothing underneath to hold it. That's gravity telling you: get out, or stay away.
Where you'd have got out
- Conservative$200.27Jan 29
- Moderate$161.13Feb 5
- Aggressive$146.12Feb 5
More of this year's Gravity Breaks:
- Jan 27TXNGravity Break · daily · all three targets · $196.63 to $231.19 in 15 days+18%
- Apr 1MRVLGravity Break · daily · out on its 30-day Friday · $106.71 to $164.95 in 30 days+55%
- Jan 5LMTGravity Break · daily · out on its 30-day Friday · $511.57 to $623.58 in 32 days+22%
Daily Gravity Breaks, volume confirmed, run back on this year's charts. Examples, not a promise about the next one. Plenty of calls hit the stop.
2.5 million candles read every week, so you never draw a zone.
14-day money-back guarantee · instant access in your members area
Three targets. Locked the moment you're in.
Every call comes with three. Conservative, moderate, aggressive. They're set at the swing highs above when the call fires, and they never move. Here's oil (USO), a daily Gravity Break on January 30: in at $79.52, stop on the gravity line at $73.48.
Half off. The stop moves to your entry.
✓ hit Mar 2A quarter more off. The stop moves to the conservative.
✓ hit Mar 3The last quarter.
✓ hit Mar 5Gravity Zone Live, in your members area
Every open call is a clean card: the chart, the entry, the stop, all three targets and the option. Top plays picks the ones to look at first.
Top plays the ones to look at first
How you get out
Picked by: still near its entry (not half way to its first target or its stop), then the most room to its first target, then the newest. The options play is the best of those whose option is still near its price at the signal.
Every open call a clean card each
How you get out
How you get out
Read from Gravity Zone Live on Wed, Oct 21, 9:51 AM ET, as members saw it. Not picks for you; the row changes as the market does.
We tested more. This is better.
We tested Gravity Zone on all 250 or so stocks and ETFs the scanner watches, on the daily chart since 2022, and held out July 2025 to October 2026 to check it on months it never saw.
The one rule that made it: the candle that confirms the break has to trade at least 1.5 times its usual volume, with price above its 200-day average. Without the volume rule, the daily break made next to nothing.
Our first test was on 30 stocks, and it called the 4-hour break and the 1-hour Bounce too. On the whole list, the 4-hour break and the 1-hour Bounce didn't hold up, so they're drawn on your chart, not called. The sells lost everywhere. So Gravity Zone calls one thing, the daily Gravity Break, about one or two a week.
Everything you get with Gravity Zone
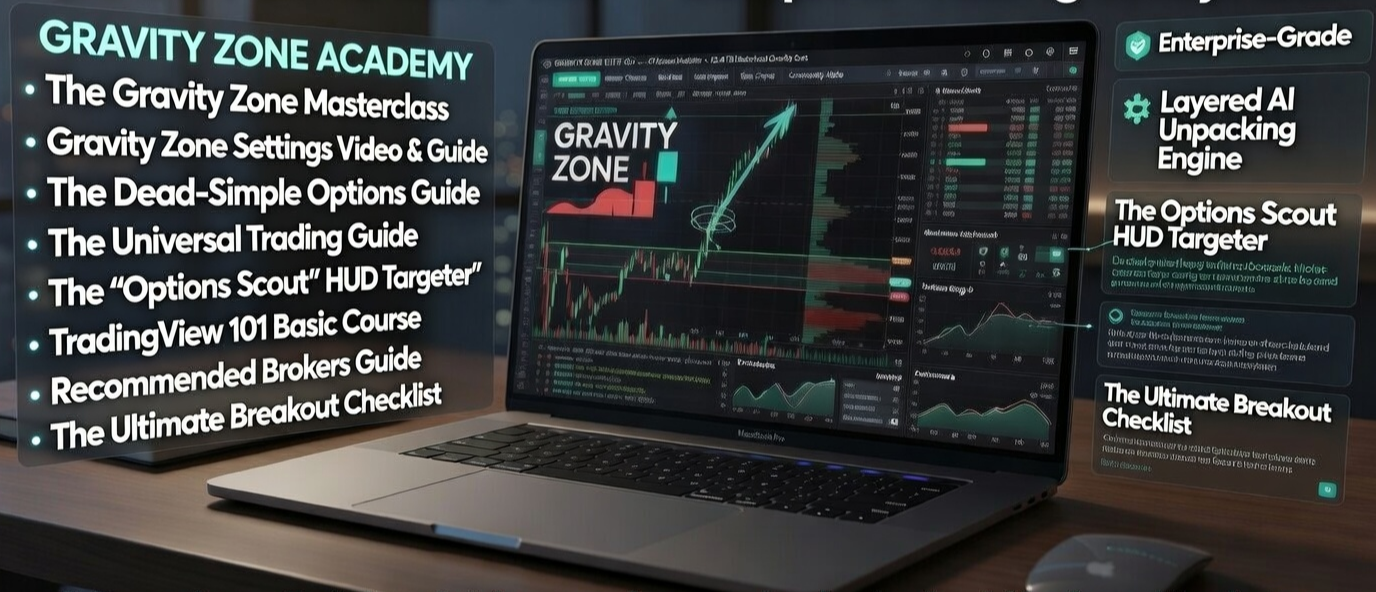
- Gravity Zone Live, in your members area NEW
The daily Gravity Break on every stock and ETF we scan, called only when the volume confirms it: drawn in neon with the zone, the buy and sell levels, the gravity line and the volume profile, three targets, the stop and the option on every card. The 4-hour and 1-hour charts are drawn too, for context.
- The Gravity Zone indicator for TradingView
The volume profile, the zone, the buy and sell levels and the gravity line on your own charts, with the breakout signals. Works on the free TradingView plan.
- Three targets, locked when you are in
Conservative, moderate and aggressive, set the moment a call fires: no moving goalposts.
- The whole chart, read for you
The bounce back inside the zone and the breakdown out of the bottom are drawn on your chart, so you can see what gravity is doing. They are not calls: only the volume-confirmed daily break held up in testing.
- The options play on every call
A monthly at-the-money option, 37 to 60 days out, named on the card.
- Every future update
When Gravity Zone improves, your copy updates for free.
14-day money-back guarantee
14 days, no questions asked
Use Gravity Zone for 14 days. If it is not for you, ask through Support in your dashboard and you get every penny back. No questions asked.

Hi, I'm Ben. I built this to save my own account.
I spent years getting chopped up inside ranges, so I studied where the volume really sat. Drawing those levels by hand was exhausting, so I coded a tool to do it for my own trading.
I've been part of building trading tools for close to a decade, me and a really great team: TriTrader+, MagniZone, the Morning Power Hour system and others thousands of traders have used.
Frequently asked questions
What does it call?
One thing: the Gravity Break on the daily chart, when the candle that confirms it trades at least 1.5 times its usual volume and price is above its 200-day average. That is what held up in testing. The bounce and the 4-hour and 1-hour charts are drawn for you to read, and the breakdown as a warning; none of them is a call.
I knew Gravity Zone with 4-hour and 1-hour calls. What changed?
We tested more, and this is better. On all the stocks and ETFs we scan, only the volume-confirmed daily break held up on the months the test never saw. The 4-hour break and the 1-hour Bounce did not, so they are drawn, not called. Any of those calls still open from before the change stay in the members area, marked "not a call any more", until they close.
Were the charts on this page live calls?
No. They're this year's charts run back through Gravity Zone, drawn the way the call stood the moment it fired. Gravity Zone Live opened to members in October.
Which option does it name?
A monthly at the money, 37 to 60 days out, so it outlives the trade. You can trade the shares instead; the targets and stop are the same.
Do I need TradingView?
No. Gravity Zone Live runs in your members area. The TradingView indicator is included and works on the free plan.
Does every call work?
No. Some hit the stop. This page shows good ones; the record inside keeps all of them.
I already own Gravity Zone. Do I need this?
No. The new Gravity Zone is already yours in your members area. This page is for traders who do not have it yet.
Is this a subscription?
No. $147 once, lifetime access. No monthly or yearly charges.
What if it's not for me?
Use Gravity Zone for 14 days. If it is not for you, ask through Support in your dashboard and you get every penny back. No questions asked.
Price has gravity. Trade the escape.
Somewhere this week a chart will be knocking at the door. In one version you find out after it ran. In the other, the zone was already on your chart, the escape was confirmed on the close, and three targets were locked before your fill.
P.S. Your login works within a couple of minutes of ordering. 14 days, no questions asked: if Gravity Zone isn't for you, ask through Support in your dashboard.